Lumbee vs Immigrants from Australia In Labor Force | Age 20-64
COMPARE
Lumbee
Immigrants from Australia
In Labor Force | Age 20-64
In Labor Force | Age 20-64 Comparison
Lumbee
Immigrants from Australia
70.6%
IN LABOR FORCE | AGE 20-64
0.0/ 100
METRIC RATING
344th/ 347
METRIC RANK
80.0%
IN LABOR FORCE | AGE 20-64
95.5/ 100
METRIC RATING
102nd/ 347
METRIC RANK
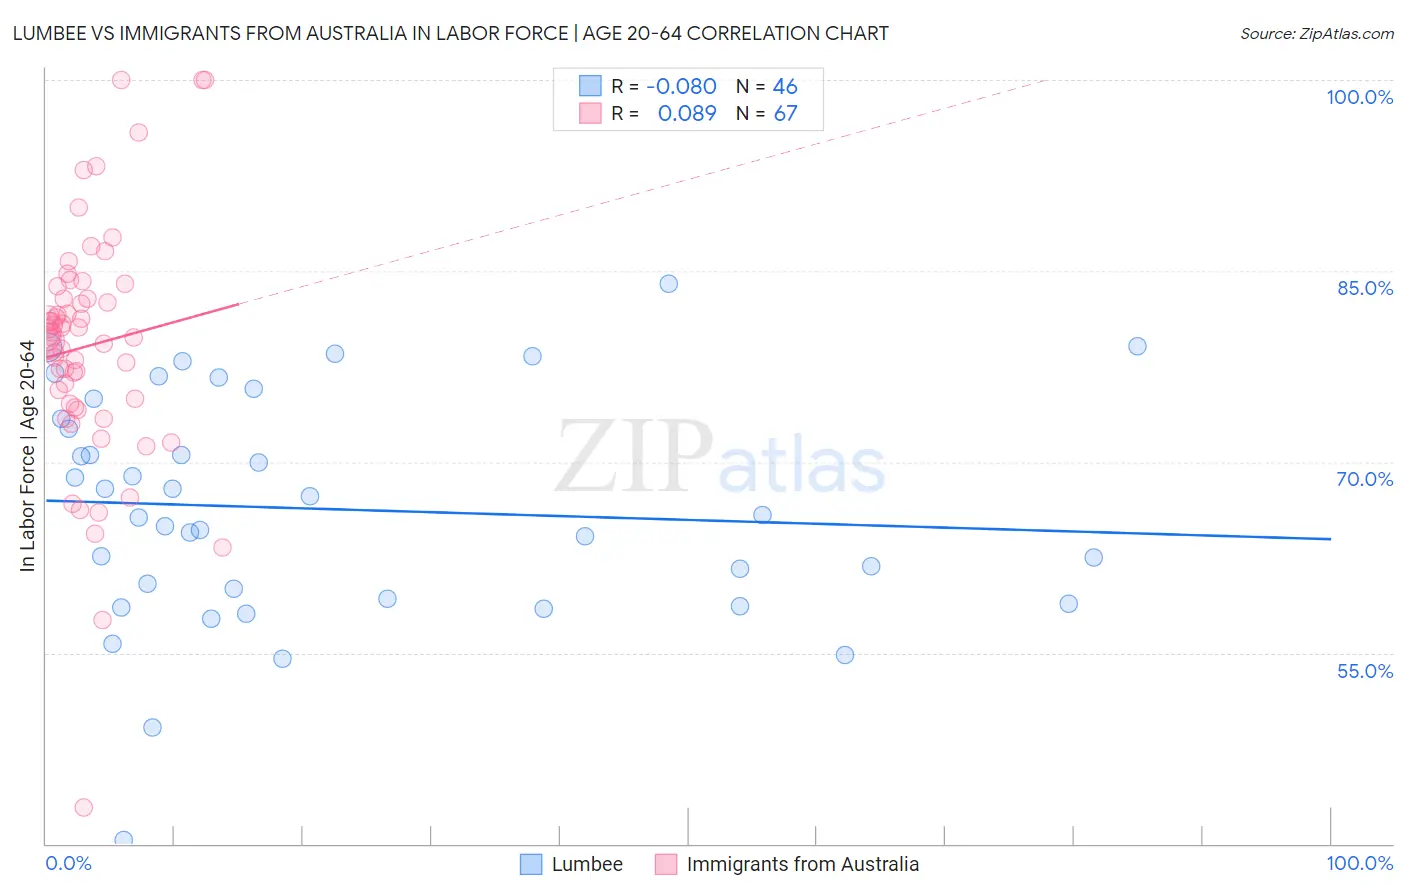
Lumbee vs Immigrants from Australia In Labor Force | Age 20-64 Correlation Chart
The statistical analysis conducted on geographies consisting of 92,293,168 people shows a slight negative correlation between the proportion of Lumbee and labor force participation rate among population between the ages 20 and 64 in the United States with a correlation coefficient (R) of -0.080 and weighted average of 70.6%. Similarly, the statistical analysis conducted on geographies consisting of 227,207,556 people shows a slight positive correlation between the proportion of Immigrants from Australia and labor force participation rate among population between the ages 20 and 64 in the United States with a correlation coefficient (R) of 0.089 and weighted average of 80.0%, a difference of 13.3%.
In Labor Force | Age 20-64 Correlation Summary
| Measurement | Lumbee | Immigrants from Australia |
| Minimum | 40.3% | 42.8% |
| Maximum | 84.0% | 100.0% |
| Range | 43.7% | 57.2% |
| Mean | 66.3% | 79.1% |
| Median | 65.7% | 79.8% |
| Interquartile 25% (IQ1) | 59.2% | 74.5% |
| Interquartile 75% (IQ3) | 73.4% | 82.8% |
| Interquartile Range (IQR) | 14.2% | 8.3% |
| Standard Deviation (Sample) | 9.0% | 9.4% |
| Standard Deviation (Population) | 8.9% | 9.3% |
Similar Demographics by In Labor Force | Age 20-64
Demographics Similar to Lumbee by In Labor Force | Age 20-64
In terms of in labor force | age 20-64, the demographic groups most similar to Lumbee are Tohono O'odham (70.4%, a difference of 0.33%), Hopi (71.7%, a difference of 1.5%), Yuman (71.7%, a difference of 1.5%), Navajo (69.2%, a difference of 2.1%), and Pima (69.0%, a difference of 2.3%).
| Demographics | Rating | Rank | In Labor Force | Age 20-64 |
| Natives/Alaskans | 0.0 /100 | #333 | Tragic 73.9% |
| Apache | 0.0 /100 | #334 | Tragic 73.7% |
| Ute | 0.0 /100 | #335 | Tragic 73.7% |
| Crow | 0.0 /100 | #336 | Tragic 73.3% |
| Yup'ik | 0.0 /100 | #337 | Tragic 73.2% |
| Puerto Ricans | 0.0 /100 | #338 | Tragic 73.1% |
| Houma | 0.0 /100 | #339 | Tragic 72.7% |
| Pueblo | 0.0 /100 | #340 | Tragic 72.6% |
| Immigrants | Yemen | 0.0 /100 | #341 | Tragic 72.3% |
| Yuman | 0.0 /100 | #342 | Tragic 71.7% |
| Hopi | 0.0 /100 | #343 | Tragic 71.7% |
| Lumbee | 0.0 /100 | #344 | Tragic 70.6% |
| Tohono O'odham | 0.0 /100 | #345 | Tragic 70.4% |
| Navajo | 0.0 /100 | #346 | Tragic 69.2% |
| Pima | 0.0 /100 | #347 | Tragic 69.0% |
Demographics Similar to Immigrants from Australia by In Labor Force | Age 20-64
In terms of in labor force | age 20-64, the demographic groups most similar to Immigrants from Australia are Filipino (80.1%, a difference of 0.0%), Palestinian (80.0%, a difference of 0.0%), Russian (80.0%, a difference of 0.0%), Immigrants from Chile (80.1%, a difference of 0.010%), and Venezuelan (80.0%, a difference of 0.010%).
| Demographics | Rating | Rank | In Labor Force | Age 20-64 |
| Yugoslavians | 95.9 /100 | #95 | Exceptional 80.1% |
| Immigrants | Malaysia | 95.9 /100 | #96 | Exceptional 80.1% |
| South Americans | 95.9 /100 | #97 | Exceptional 80.1% |
| Immigrants | Uruguay | 95.8 /100 | #98 | Exceptional 80.1% |
| Immigrants | Chile | 95.7 /100 | #99 | Exceptional 80.1% |
| Filipinos | 95.6 /100 | #100 | Exceptional 80.1% |
| Palestinians | 95.5 /100 | #101 | Exceptional 80.0% |
| Immigrants | Australia | 95.5 /100 | #102 | Exceptional 80.0% |
| Russians | 95.5 /100 | #103 | Exceptional 80.0% |
| Venezuelans | 95.3 /100 | #104 | Exceptional 80.0% |
| Immigrants | Ghana | 95.0 /100 | #105 | Exceptional 80.0% |
| Greeks | 94.8 /100 | #106 | Exceptional 80.0% |
| Immigrants | Jordan | 94.8 /100 | #107 | Exceptional 80.0% |
| Iranians | 94.3 /100 | #108 | Exceptional 80.0% |
| Immigrants | Argentina | 94.1 /100 | #109 | Exceptional 80.0% |