Samoan vs Seminole Family Households with Children
COMPARE
Samoan
Seminole
Family Households with Children
Family Households with Children Comparison
Samoans
Seminole
29.5%
FAMILY HOUSEHOLDS WITH CHILDREN
100.0/ 100
METRIC RATING
28th/ 347
METRIC RANK
27.5%
FAMILY HOUSEHOLDS WITH CHILDREN
56.9/ 100
METRIC RATING
169th/ 347
METRIC RANK
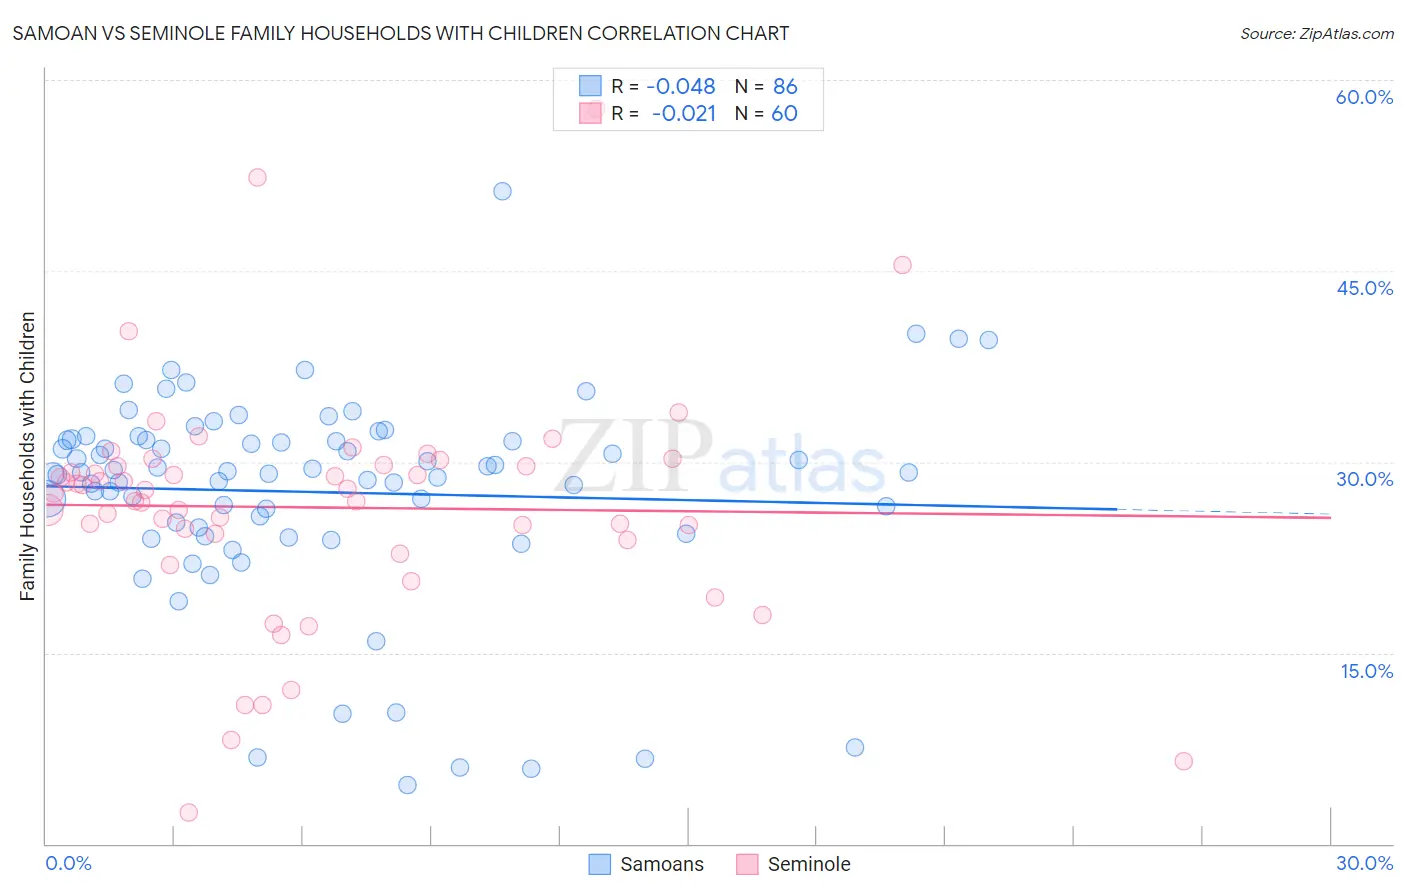
Samoan vs Seminole Family Households with Children Correlation Chart
The statistical analysis conducted on geographies consisting of 225,025,987 people shows no correlation between the proportion of Samoans and percentage of family households with children in the United States with a correlation coefficient (R) of -0.048 and weighted average of 29.5%. Similarly, the statistical analysis conducted on geographies consisting of 118,297,441 people shows no correlation between the proportion of Seminole and percentage of family households with children in the United States with a correlation coefficient (R) of -0.021 and weighted average of 27.5%, a difference of 7.3%.
Family Households with Children Correlation Summary
| Measurement | Samoan | Seminole |
| Minimum | 4.6% | 2.4% |
| Maximum | 51.3% | 57.7% |
| Range | 46.7% | 55.3% |
| Mean | 27.6% | 26.4% |
| Median | 29.2% | 27.6% |
| Interquartile 25% (IQ1) | 24.8% | 24.1% |
| Interquartile 75% (IQ3) | 31.8% | 29.7% |
| Interquartile Range (IQR) | 6.9% | 5.6% |
| Standard Deviation (Sample) | 8.3% | 9.2% |
| Standard Deviation (Population) | 8.2% | 9.2% |
Similar Demographics by Family Households with Children
Demographics Similar to Samoans by Family Households with Children
In terms of family households with children, the demographic groups most similar to Samoans are Bolivian (29.5%, a difference of 0.0%), Yuman (29.5%, a difference of 0.040%), Immigrants from Vietnam (29.5%, a difference of 0.16%), Sri Lankan (29.5%, a difference of 0.18%), and Japanese (29.4%, a difference of 0.18%).
| Demographics | Rating | Rank | Family Households with Children |
| Immigrants | Laos | 100.0 /100 | #21 | Exceptional 29.8% |
| Malaysians | 100.0 /100 | #22 | Exceptional 29.8% |
| Mexican American Indians | 100.0 /100 | #23 | Exceptional 29.7% |
| Guamanians/Chamorros | 100.0 /100 | #24 | Exceptional 29.7% |
| Immigrants | Latin America | 100.0 /100 | #25 | Exceptional 29.7% |
| Sri Lankans | 100.0 /100 | #26 | Exceptional 29.5% |
| Immigrants | Vietnam | 100.0 /100 | #27 | Exceptional 29.5% |
| Samoans | 100.0 /100 | #28 | Exceptional 29.5% |
| Bolivians | 100.0 /100 | #29 | Exceptional 29.5% |
| Yuman | 100.0 /100 | #30 | Exceptional 29.5% |
| Japanese | 100.0 /100 | #31 | Exceptional 29.4% |
| Immigrants | Yemen | 100.0 /100 | #32 | Exceptional 29.4% |
| Venezuelans | 100.0 /100 | #33 | Exceptional 29.4% |
| Immigrants | Bolivia | 100.0 /100 | #34 | Exceptional 29.3% |
| Immigrants | Sierra Leone | 100.0 /100 | #35 | Exceptional 29.3% |
Demographics Similar to Seminole by Family Households with Children
In terms of family households with children, the demographic groups most similar to Seminole are Cherokee (27.5%, a difference of 0.0%), Blackfeet (27.5%, a difference of 0.060%), Israeli (27.5%, a difference of 0.070%), Immigrants from Kuwait (27.5%, a difference of 0.090%), and Immigrants from South Africa (27.5%, a difference of 0.10%).
| Demographics | Rating | Rank | Family Households with Children |
| Immigrants | Bangladesh | 67.0 /100 | #162 | Good 27.6% |
| Czechs | 65.3 /100 | #163 | Good 27.5% |
| Immigrants | Hong Kong | 64.9 /100 | #164 | Good 27.5% |
| Immigrants | South Africa | 61.3 /100 | #165 | Good 27.5% |
| Immigrants | Nonimmigrants | 61.2 /100 | #166 | Good 27.5% |
| Dominicans | 61.1 /100 | #167 | Good 27.5% |
| Immigrants | Kuwait | 60.9 /100 | #168 | Good 27.5% |
| Seminole | 56.9 /100 | #169 | Average 27.5% |
| Cherokee | 56.7 /100 | #170 | Average 27.5% |
| Blackfeet | 54.3 /100 | #171 | Average 27.5% |
| Israelis | 53.9 /100 | #172 | Average 27.5% |
| Immigrants | Argentina | 52.2 /100 | #173 | Average 27.5% |
| Whites/Caucasians | 50.0 /100 | #174 | Average 27.4% |
| British | 49.9 /100 | #175 | Average 27.4% |
| Immigrants | China | 49.6 /100 | #176 | Average 27.4% |