Immigrants from Venezuela vs Immigrants In Labor Force | Age 16-19
COMPARE
Immigrants from Venezuela
Immigrants
In Labor Force | Age 16-19
In Labor Force | Age 16-19 Comparison
Immigrants from Venezuela
Immigrants
33.7%
IN LABOR FORCE | AGE 16-19
0.2/ 100
METRIC RATING
283rd/ 347
METRIC RANK
34.6%
IN LABOR FORCE | AGE 16-19
1.2/ 100
METRIC RATING
259th/ 347
METRIC RANK
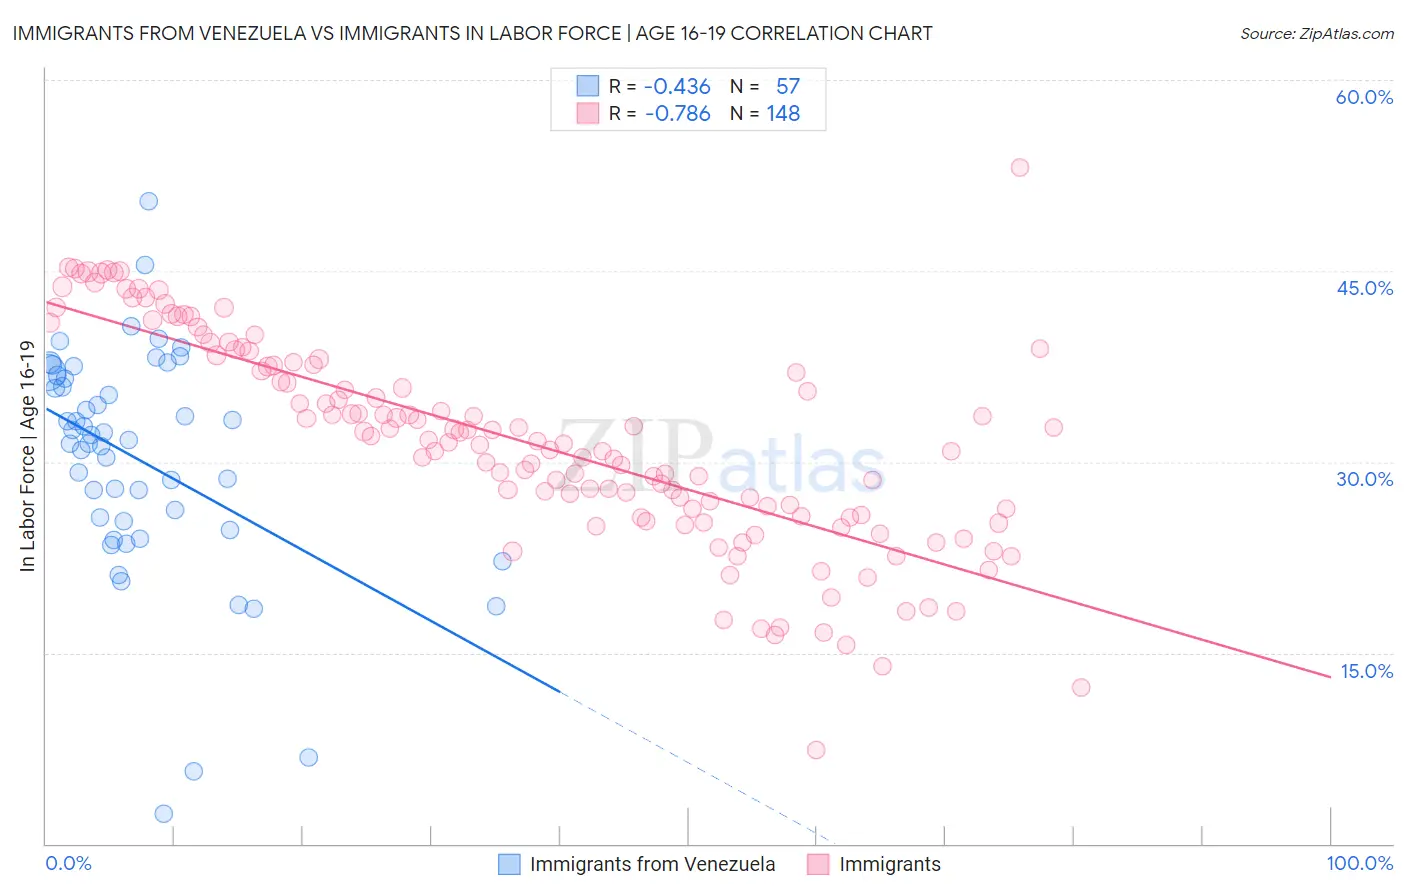
Immigrants from Venezuela vs Immigrants In Labor Force | Age 16-19 Correlation Chart
The statistical analysis conducted on geographies consisting of 287,600,436 people shows a moderate negative correlation between the proportion of Immigrants from Venezuela and labor force participation rate among population between the ages 16 and 19 in the United States with a correlation coefficient (R) of -0.436 and weighted average of 33.7%. Similarly, the statistical analysis conducted on geographies consisting of 573,117,494 people shows a strong negative correlation between the proportion of Immigrants and labor force participation rate among population between the ages 16 and 19 in the United States with a correlation coefficient (R) of -0.786 and weighted average of 34.6%, a difference of 2.5%.
In Labor Force | Age 16-19 Correlation Summary
| Measurement | Immigrants from Venezuela | Immigrants |
| Minimum | 2.4% | 7.3% |
| Maximum | 50.5% | 53.1% |
| Range | 48.1% | 45.8% |
| Mean | 30.2% | 31.5% |
| Median | 31.7% | 31.6% |
| Interquartile 25% (IQ1) | 25.0% | 25.8% |
| Interquartile 75% (IQ3) | 36.7% | 37.7% |
| Interquartile Range (IQR) | 11.7% | 12.0% |
| Standard Deviation (Sample) | 9.0% | 8.3% |
| Standard Deviation (Population) | 8.9% | 8.2% |
Similar Demographics by In Labor Force | Age 16-19
Demographics Similar to Immigrants from Venezuela by In Labor Force | Age 16-19
In terms of in labor force | age 16-19, the demographic groups most similar to Immigrants from Venezuela are Immigrants from Spain (33.7%, a difference of 0.060%), U.S. Virgin Islander (33.6%, a difference of 0.25%), South American (33.6%, a difference of 0.34%), Immigrants from Korea (33.8%, a difference of 0.35%), and Cypriot (33.8%, a difference of 0.36%).
| Demographics | Rating | Rank | In Labor Force | Age 16-19 |
| Immigrants | Latin America | 0.3 /100 | #276 | Tragic 33.9% |
| Menominee | 0.3 /100 | #277 | Tragic 33.9% |
| Colombians | 0.3 /100 | #278 | Tragic 33.8% |
| Paraguayans | 0.3 /100 | #279 | Tragic 33.8% |
| Taiwanese | 0.3 /100 | #280 | Tragic 33.8% |
| Cypriots | 0.3 /100 | #281 | Tragic 33.8% |
| Immigrants | Korea | 0.3 /100 | #282 | Tragic 33.8% |
| Immigrants | Venezuela | 0.2 /100 | #283 | Tragic 33.7% |
| Immigrants | Spain | 0.2 /100 | #284 | Tragic 33.7% |
| U.S. Virgin Islanders | 0.2 /100 | #285 | Tragic 33.6% |
| South Americans | 0.2 /100 | #286 | Tragic 33.6% |
| Nepalese | 0.1 /100 | #287 | Tragic 33.5% |
| Immigrants | Indonesia | 0.1 /100 | #288 | Tragic 33.5% |
| Immigrants | Singapore | 0.1 /100 | #289 | Tragic 33.5% |
| Immigrants | Colombia | 0.1 /100 | #290 | Tragic 33.5% |
Demographics Similar to Immigrants by In Labor Force | Age 16-19
In terms of in labor force | age 16-19, the demographic groups most similar to Immigrants are Immigrants from Egypt (34.6%, a difference of 0.020%), Thai (34.6%, a difference of 0.020%), Immigrants from South Central Asia (34.6%, a difference of 0.030%), Egyptian (34.5%, a difference of 0.080%), and Salvadoran (34.5%, a difference of 0.12%).
| Demographics | Rating | Rank | In Labor Force | Age 16-19 |
| Immigrants | Chile | 2.0 /100 | #252 | Tragic 34.8% |
| Immigrants | Japan | 1.5 /100 | #253 | Tragic 34.7% |
| Bahamians | 1.4 /100 | #254 | Tragic 34.6% |
| Peruvians | 1.4 /100 | #255 | Tragic 34.6% |
| Immigrants | South Central Asia | 1.3 /100 | #256 | Tragic 34.6% |
| Immigrants | Egypt | 1.2 /100 | #257 | Tragic 34.6% |
| Thais | 1.2 /100 | #258 | Tragic 34.6% |
| Immigrants | Immigrants | 1.2 /100 | #259 | Tragic 34.6% |
| Egyptians | 1.2 /100 | #260 | Tragic 34.5% |
| Salvadorans | 1.1 /100 | #261 | Tragic 34.5% |
| Hispanics or Latinos | 1.1 /100 | #262 | Tragic 34.5% |
| Burmese | 1.1 /100 | #263 | Tragic 34.5% |
| Immigrants | Uruguay | 0.9 /100 | #264 | Tragic 34.4% |
| Immigrants | El Salvador | 0.7 /100 | #265 | Tragic 34.3% |
| Immigrants | Malaysia | 0.7 /100 | #266 | Tragic 34.3% |