Samoan vs Immigrants from Ireland In Labor Force | Age 35-44
COMPARE
Samoan
Immigrants from Ireland
In Labor Force | Age 35-44
In Labor Force | Age 35-44 Comparison
Samoans
Immigrants from Ireland
83.2%
IN LABOR FORCE | AGE 35-44
0.0/ 100
METRIC RATING
277th/ 347
METRIC RANK
85.6%
IN LABOR FORCE | AGE 35-44
100.0/ 100
METRIC RATING
16th/ 347
METRIC RANK
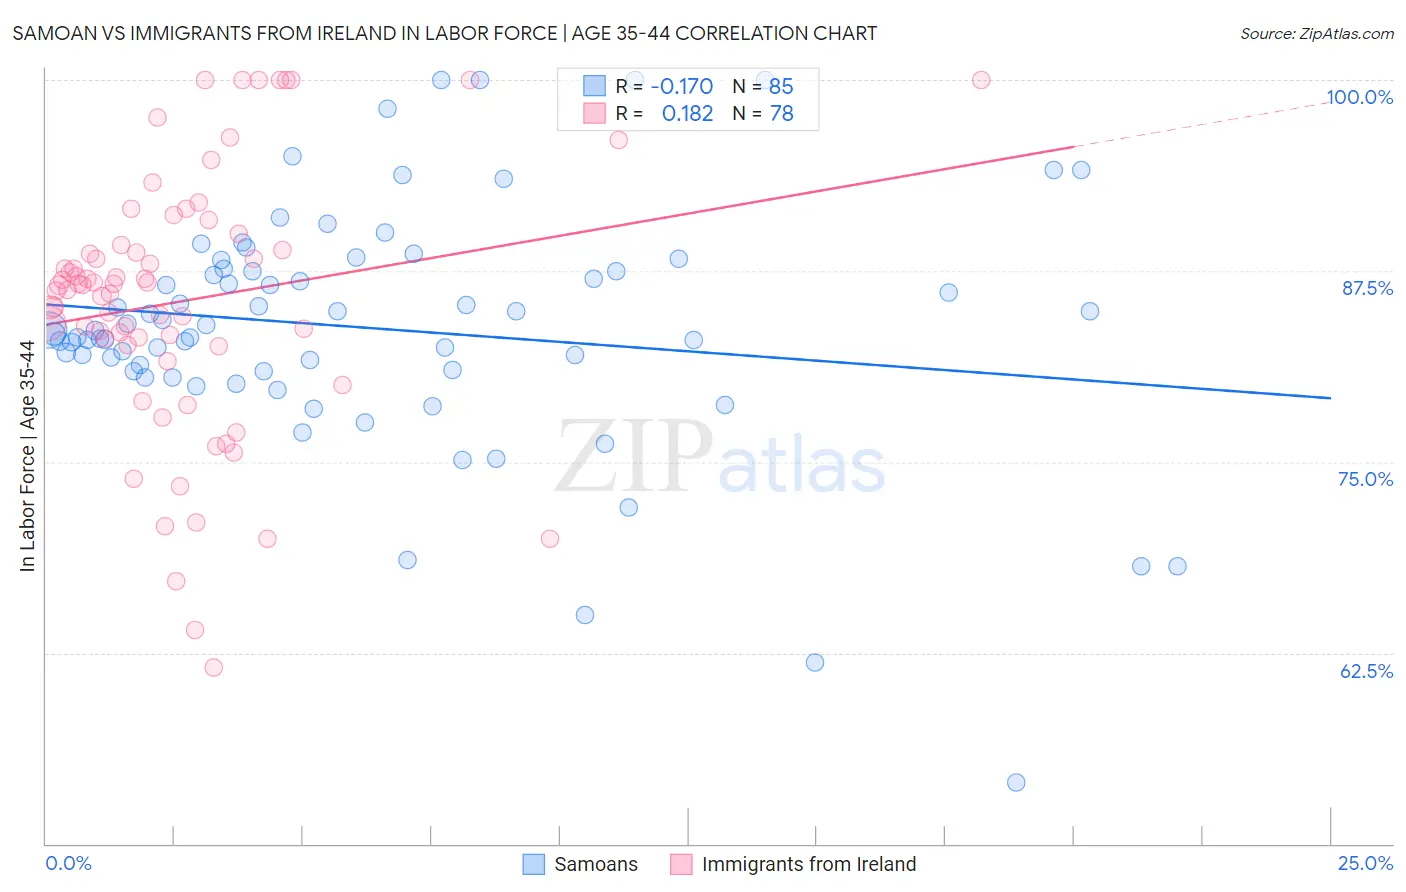
Samoan vs Immigrants from Ireland In Labor Force | Age 35-44 Correlation Chart
The statistical analysis conducted on geographies consisting of 225,132,853 people shows a poor negative correlation between the proportion of Samoans and labor force participation rate among population between the ages 35 and 44 in the United States with a correlation coefficient (R) of -0.170 and weighted average of 83.2%. Similarly, the statistical analysis conducted on geographies consisting of 240,753,518 people shows a poor positive correlation between the proportion of Immigrants from Ireland and labor force participation rate among population between the ages 35 and 44 in the United States with a correlation coefficient (R) of 0.182 and weighted average of 85.6%, a difference of 2.9%.
In Labor Force | Age 35-44 Correlation Summary
| Measurement | Samoan | Immigrants from Ireland |
| Minimum | 54.0% | 61.5% |
| Maximum | 100.0% | 100.0% |
| Range | 46.0% | 38.5% |
| Mean | 83.7% | 85.5% |
| Median | 83.6% | 86.6% |
| Interquartile 25% (IQ1) | 80.9% | 82.7% |
| Interquartile 75% (IQ3) | 87.6% | 89.2% |
| Interquartile Range (IQR) | 6.7% | 6.5% |
| Standard Deviation (Sample) | 7.9% | 8.6% |
| Standard Deviation (Population) | 7.9% | 8.5% |
Similar Demographics by In Labor Force | Age 35-44
Demographics Similar to Samoans by In Labor Force | Age 35-44
In terms of in labor force | age 35-44, the demographic groups most similar to Samoans are Delaware (83.2%, a difference of 0.010%), Hawaiian (83.2%, a difference of 0.020%), Nonimmigrants (83.2%, a difference of 0.030%), Immigrants from Fiji (83.2%, a difference of 0.050%), and Spanish (83.2%, a difference of 0.050%).
| Demographics | Rating | Rank | In Labor Force | Age 35-44 |
| Immigrants | Honduras | 0.0 /100 | #270 | Tragic 83.3% |
| French American Indians | 0.0 /100 | #271 | Tragic 83.2% |
| Immigrants | Fiji | 0.0 /100 | #272 | Tragic 83.2% |
| Spanish | 0.0 /100 | #273 | Tragic 83.2% |
| Immigrants | Nonimmigrants | 0.0 /100 | #274 | Tragic 83.2% |
| Hawaiians | 0.0 /100 | #275 | Tragic 83.2% |
| Delaware | 0.0 /100 | #276 | Tragic 83.2% |
| Samoans | 0.0 /100 | #277 | Tragic 83.2% |
| Belizeans | 0.0 /100 | #278 | Tragic 83.1% |
| Immigrants | Micronesia | 0.0 /100 | #279 | Tragic 83.1% |
| Dominicans | 0.0 /100 | #280 | Tragic 83.1% |
| Guatemalans | 0.0 /100 | #281 | Tragic 83.0% |
| Osage | 0.0 /100 | #282 | Tragic 82.9% |
| Immigrants | Guatemala | 0.0 /100 | #283 | Tragic 82.9% |
| Immigrants | Dominican Republic | 0.0 /100 | #284 | Tragic 82.9% |
Demographics Similar to Immigrants from Ireland by In Labor Force | Age 35-44
In terms of in labor force | age 35-44, the demographic groups most similar to Immigrants from Ireland are Norwegian (85.6%, a difference of 0.0%), Somali (85.6%, a difference of 0.040%), Immigrants from Somalia (85.6%, a difference of 0.040%), Immigrants from North Macedonia (85.6%, a difference of 0.050%), and Carpatho Rusyn (85.6%, a difference of 0.050%).
| Demographics | Rating | Rank | In Labor Force | Age 35-44 |
| Ethiopians | 100.0 /100 | #9 | Exceptional 85.9% |
| Cape Verdeans | 100.0 /100 | #10 | Exceptional 85.8% |
| Immigrants | Cameroon | 100.0 /100 | #11 | Exceptional 85.8% |
| Liberians | 100.0 /100 | #12 | Exceptional 85.7% |
| Somalis | 100.0 /100 | #13 | Exceptional 85.6% |
| Immigrants | Somalia | 100.0 /100 | #14 | Exceptional 85.6% |
| Norwegians | 100.0 /100 | #15 | Exceptional 85.6% |
| Immigrants | Ireland | 100.0 /100 | #16 | Exceptional 85.6% |
| Immigrants | North Macedonia | 100.0 /100 | #17 | Exceptional 85.6% |
| Carpatho Rusyns | 100.0 /100 | #18 | Exceptional 85.6% |
| Slovenes | 100.0 /100 | #19 | Exceptional 85.6% |
| Immigrants | Serbia | 100.0 /100 | #20 | Exceptional 85.5% |
| Bulgarians | 100.0 /100 | #21 | Exceptional 85.5% |
| Immigrants | Bosnia and Herzegovina | 100.0 /100 | #22 | Exceptional 85.4% |
| Immigrants | Eastern Africa | 100.0 /100 | #23 | Exceptional 85.4% |