Salvadoran vs Spanish American 11th Grade
COMPARE
Salvadoran
Spanish American
11th Grade
11th Grade Comparison
Salvadorans
Spanish Americans
86.2%
11TH GRADE
0.0/ 100
METRIC RATING
340th/ 347
METRIC RANK
91.4%
11TH GRADE
0.6/ 100
METRIC RATING
260th/ 347
METRIC RANK
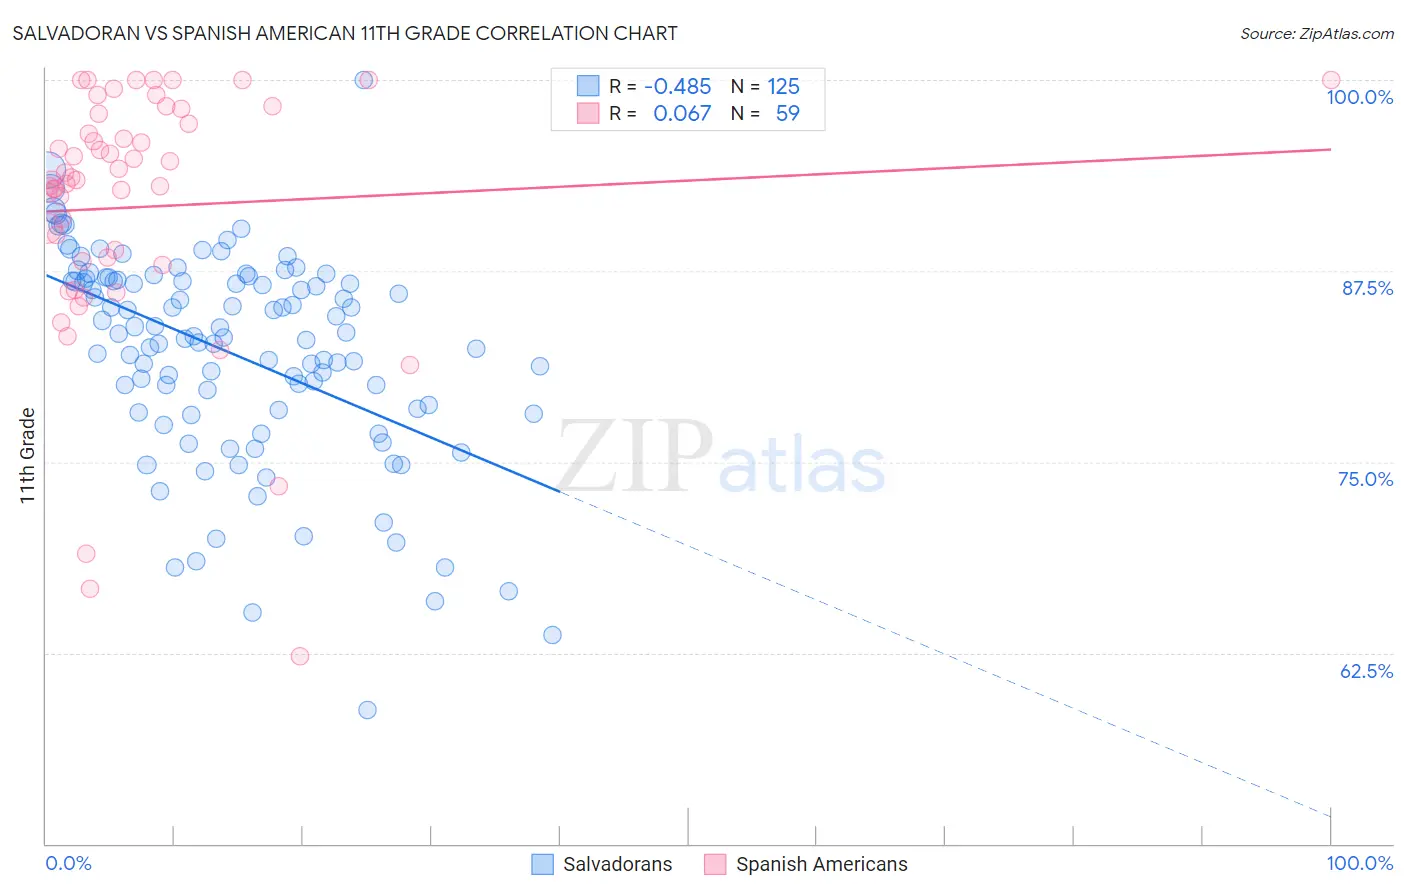
Salvadoran vs Spanish American 11th Grade Correlation Chart
The statistical analysis conducted on geographies consisting of 399,020,036 people shows a moderate negative correlation between the proportion of Salvadorans and percentage of population with at least 11th grade education in the United States with a correlation coefficient (R) of -0.485 and weighted average of 86.2%. Similarly, the statistical analysis conducted on geographies consisting of 103,168,542 people shows a slight positive correlation between the proportion of Spanish Americans and percentage of population with at least 11th grade education in the United States with a correlation coefficient (R) of 0.067 and weighted average of 91.4%, a difference of 6.0%.
11th Grade Correlation Summary
| Measurement | Salvadoran | Spanish American |
| Minimum | 58.8% | 62.3% |
| Maximum | 100.0% | 100.0% |
| Range | 41.2% | 37.7% |
| Mean | 82.1% | 91.7% |
| Median | 83.2% | 93.5% |
| Interquartile 25% (IQ1) | 78.3% | 88.1% |
| Interquartile 75% (IQ3) | 86.9% | 97.8% |
| Interquartile Range (IQR) | 8.6% | 9.7% |
| Standard Deviation (Sample) | 6.9% | 8.3% |
| Standard Deviation (Population) | 6.9% | 8.2% |
Similar Demographics by 11th Grade
Demographics Similar to Salvadorans by 11th Grade
In terms of 11th grade, the demographic groups most similar to Salvadorans are Mexican (86.1%, a difference of 0.060%), Guatemalan (86.4%, a difference of 0.23%), Immigrants from Guatemala (85.8%, a difference of 0.39%), Immigrants from Latin America (86.8%, a difference of 0.73%), and Immigrants from Dominican Republic (86.9%, a difference of 0.85%).
| Demographics | Rating | Rank | 11th Grade |
| Immigrants | Yemen | 0.0 /100 | #333 | Tragic 87.1% |
| Houma | 0.0 /100 | #334 | Tragic 87.0% |
| Central Americans | 0.0 /100 | #335 | Tragic 86.9% |
| Immigrants | Dominican Republic | 0.0 /100 | #336 | Tragic 86.9% |
| Immigrants | Honduras | 0.0 /100 | #337 | Tragic 86.9% |
| Immigrants | Latin America | 0.0 /100 | #338 | Tragic 86.8% |
| Guatemalans | 0.0 /100 | #339 | Tragic 86.4% |
| Salvadorans | 0.0 /100 | #340 | Tragic 86.2% |
| Mexicans | 0.0 /100 | #341 | Tragic 86.1% |
| Immigrants | Guatemala | 0.0 /100 | #342 | Tragic 85.8% |
| Immigrants | El Salvador | 0.0 /100 | #343 | Tragic 85.3% |
| Yakama | 0.0 /100 | #344 | Tragic 85.0% |
| Immigrants | Central America | 0.0 /100 | #345 | Tragic 84.9% |
| Spanish American Indians | 0.0 /100 | #346 | Tragic 84.7% |
| Immigrants | Mexico | 0.0 /100 | #347 | Tragic 84.5% |
Demographics Similar to Spanish Americans by 11th Grade
In terms of 11th grade, the demographic groups most similar to Spanish Americans are Jamaican (91.4%, a difference of 0.010%), Taiwanese (91.3%, a difference of 0.010%), Immigrants from Colombia (91.4%, a difference of 0.020%), Immigrants from Uruguay (91.3%, a difference of 0.020%), and Cajun (91.4%, a difference of 0.040%).
| Demographics | Rating | Rank | 11th Grade |
| Immigrants | South America | 0.8 /100 | #253 | Tragic 91.4% |
| Immigrants | Eritrea | 0.7 /100 | #254 | Tragic 91.4% |
| Blacks/African Americans | 0.7 /100 | #255 | Tragic 91.4% |
| Immigrants | Senegal | 0.7 /100 | #256 | Tragic 91.4% |
| Cajuns | 0.7 /100 | #257 | Tragic 91.4% |
| Immigrants | Colombia | 0.6 /100 | #258 | Tragic 91.4% |
| Jamaicans | 0.6 /100 | #259 | Tragic 91.4% |
| Spanish Americans | 0.6 /100 | #260 | Tragic 91.4% |
| Taiwanese | 0.6 /100 | #261 | Tragic 91.3% |
| Immigrants | Uruguay | 0.5 /100 | #262 | Tragic 91.3% |
| Immigrants | Ghana | 0.3 /100 | #263 | Tragic 91.2% |
| Yup'ik | 0.3 /100 | #264 | Tragic 91.2% |
| Pueblo | 0.3 /100 | #265 | Tragic 91.2% |
| Immigrants | Western Africa | 0.3 /100 | #266 | Tragic 91.2% |
| Immigrants | Jamaica | 0.3 /100 | #267 | Tragic 91.2% |