Salvadoran vs Immigrants from Canada In Labor Force | Age 45-54
COMPARE
Salvadoran
Immigrants from Canada
In Labor Force | Age 45-54
In Labor Force | Age 45-54 Comparison
Salvadorans
Immigrants from Canada
82.0%
IN LABOR FORCE | AGE 45-54
1.7/ 100
METRIC RATING
234th/ 347
METRIC RANK
82.5%
IN LABOR FORCE | AGE 45-54
20.0/ 100
METRIC RATING
195th/ 347
METRIC RANK
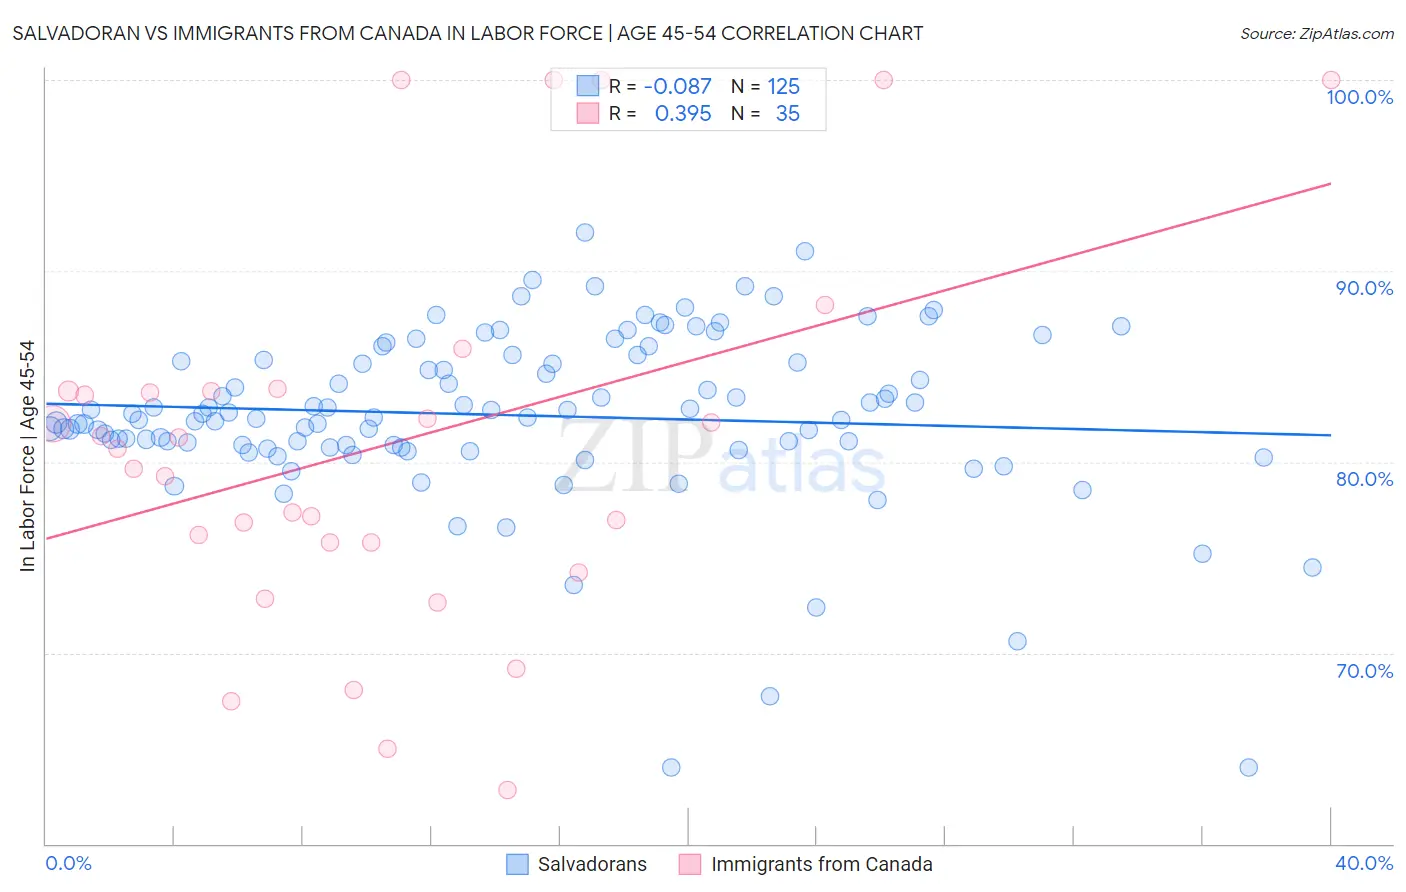
Salvadoran vs Immigrants from Canada In Labor Force | Age 45-54 Correlation Chart
The statistical analysis conducted on geographies consisting of 398,682,111 people shows a slight negative correlation between the proportion of Salvadorans and labor force participation rate among population between the ages 45 and 54 in the United States with a correlation coefficient (R) of -0.087 and weighted average of 82.0%. Similarly, the statistical analysis conducted on geographies consisting of 459,096,447 people shows a mild positive correlation between the proportion of Immigrants from Canada and labor force participation rate among population between the ages 45 and 54 in the United States with a correlation coefficient (R) of 0.395 and weighted average of 82.5%, a difference of 0.60%.
In Labor Force | Age 45-54 Correlation Summary
| Measurement | Salvadoran | Immigrants from Canada |
| Minimum | 64.0% | 62.8% |
| Maximum | 92.0% | 100.0% |
| Range | 28.0% | 37.2% |
| Mean | 82.4% | 80.8% |
| Median | 82.4% | 80.7% |
| Interquartile 25% (IQ1) | 80.8% | 75.8% |
| Interquartile 75% (IQ3) | 85.3% | 83.7% |
| Interquartile Range (IQR) | 4.5% | 8.0% |
| Standard Deviation (Sample) | 4.5% | 9.9% |
| Standard Deviation (Population) | 4.5% | 9.7% |
Similar Demographics by In Labor Force | Age 45-54
Demographics Similar to Salvadorans by In Labor Force | Age 45-54
In terms of in labor force | age 45-54, the demographic groups most similar to Salvadorans are Immigrants from Portugal (82.0%, a difference of 0.0%), Malaysian (82.0%, a difference of 0.0%), Immigrants from Senegal (82.0%, a difference of 0.010%), Jamaican (82.0%, a difference of 0.020%), and Immigrants from Burma/Myanmar (82.0%, a difference of 0.030%).
| Demographics | Rating | Rank | In Labor Force | Age 45-54 |
| Immigrants | Germany | 2.4 /100 | #227 | Tragic 82.1% |
| Cape Verdeans | 2.1 /100 | #228 | Tragic 82.1% |
| Immigrants | Burma/Myanmar | 1.9 /100 | #229 | Tragic 82.0% |
| Jamaicans | 1.8 /100 | #230 | Tragic 82.0% |
| Immigrants | Senegal | 1.7 /100 | #231 | Tragic 82.0% |
| Immigrants | Portugal | 1.7 /100 | #232 | Tragic 82.0% |
| Malaysians | 1.7 /100 | #233 | Tragic 82.0% |
| Salvadorans | 1.7 /100 | #234 | Tragic 82.0% |
| Sub-Saharan Africans | 1.2 /100 | #235 | Tragic 82.0% |
| Basques | 1.2 /100 | #236 | Tragic 82.0% |
| Immigrants | Trinidad and Tobago | 1.2 /100 | #237 | Tragic 82.0% |
| Trinidadians and Tobagonians | 1.1 /100 | #238 | Tragic 81.9% |
| Immigrants | Thailand | 1.0 /100 | #239 | Tragic 81.9% |
| Immigrants | El Salvador | 1.0 /100 | #240 | Tragic 81.9% |
| Immigrants | Cambodia | 0.8 /100 | #241 | Tragic 81.9% |
Demographics Similar to Immigrants from Canada by In Labor Force | Age 45-54
In terms of in labor force | age 45-54, the demographic groups most similar to Immigrants from Canada are Immigrants from Iraq (82.5%, a difference of 0.010%), Australian (82.5%, a difference of 0.010%), Immigrants from Norway (82.5%, a difference of 0.010%), Immigrants from North America (82.5%, a difference of 0.020%), and Lebanese (82.5%, a difference of 0.030%).
| Demographics | Rating | Rank | In Labor Force | Age 45-54 |
| South Africans | 28.0 /100 | #188 | Fair 82.6% |
| Syrians | 26.0 /100 | #189 | Fair 82.6% |
| British | 25.7 /100 | #190 | Fair 82.6% |
| Armenians | 23.2 /100 | #191 | Fair 82.5% |
| Immigrants | Iraq | 20.9 /100 | #192 | Fair 82.5% |
| Australians | 20.8 /100 | #193 | Fair 82.5% |
| Immigrants | Norway | 20.7 /100 | #194 | Fair 82.5% |
| Immigrants | Canada | 20.0 /100 | #195 | Fair 82.5% |
| Immigrants | North America | 18.8 /100 | #196 | Poor 82.5% |
| Lebanese | 18.2 /100 | #197 | Poor 82.5% |
| Immigrants | Denmark | 17.9 /100 | #198 | Poor 82.5% |
| Moroccans | 15.7 /100 | #199 | Poor 82.5% |
| French Canadians | 15.4 /100 | #200 | Poor 82.5% |
| Canadians | 15.1 /100 | #201 | Poor 82.4% |
| Immigrants | Western Asia | 14.9 /100 | #202 | Poor 82.4% |