Salvadoran vs Immigrants from Canada 12th Grade, No Diploma
COMPARE
Salvadoran
Immigrants from Canada
12th Grade, No Diploma
12th Grade, No Diploma Comparison
Salvadorans
Immigrants from Canada
84.5%
12TH GRADE, NO DIPLOMA
0.0/ 100
METRIC RATING
339th/ 347
METRIC RANK
92.8%
12TH GRADE, NO DIPLOMA
99.7/ 100
METRIC RATING
57th/ 347
METRIC RANK
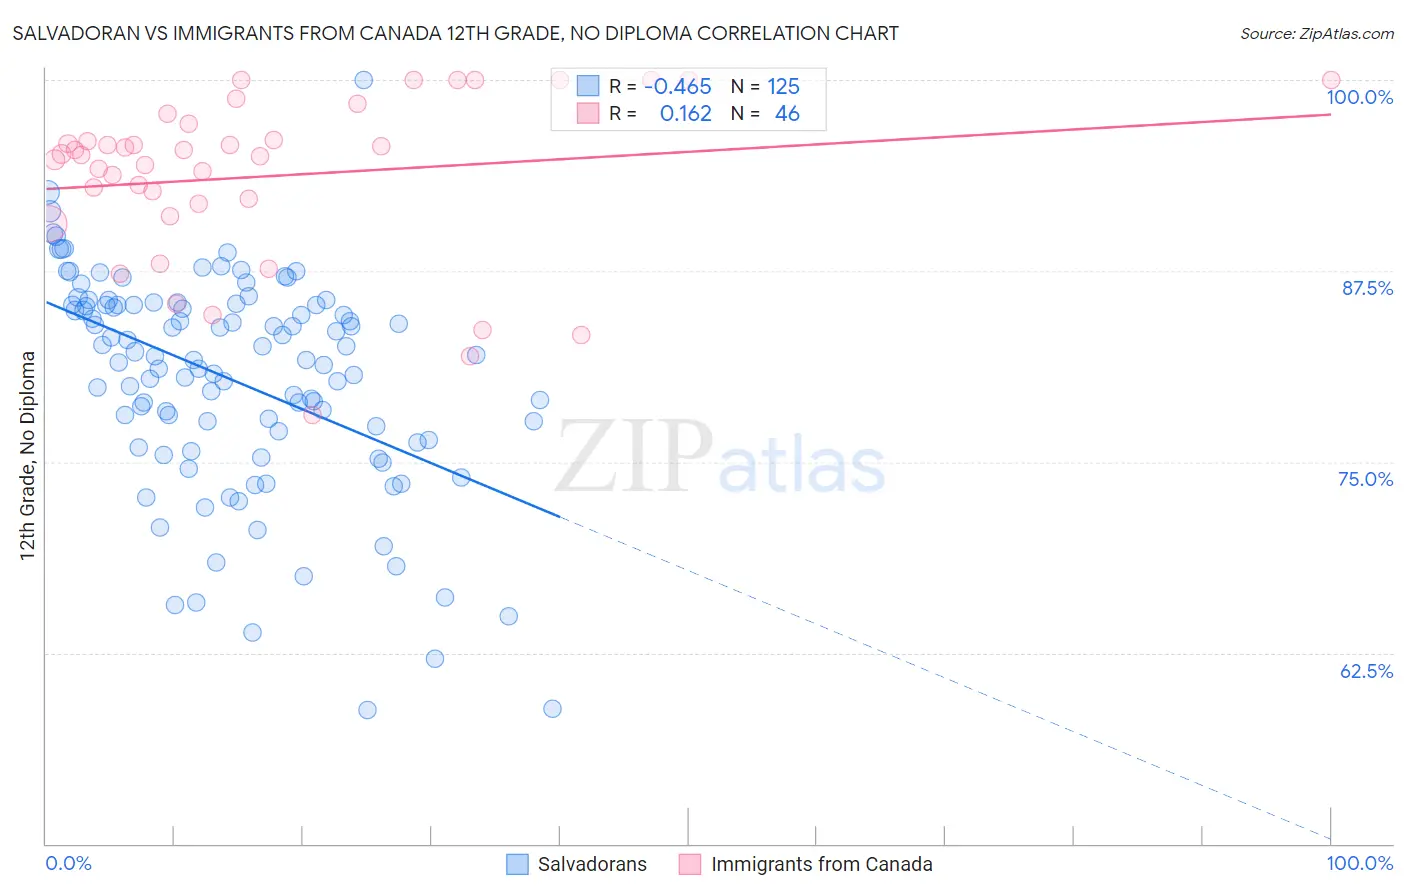
Salvadoran vs Immigrants from Canada 12th Grade, No Diploma Correlation Chart
The statistical analysis conducted on geographies consisting of 399,020,036 people shows a moderate negative correlation between the proportion of Salvadorans and percentage of population with at least 12th grade (no diploma) education in the United States with a correlation coefficient (R) of -0.465 and weighted average of 84.5%. Similarly, the statistical analysis conducted on geographies consisting of 459,397,067 people shows a poor positive correlation between the proportion of Immigrants from Canada and percentage of population with at least 12th grade (no diploma) education in the United States with a correlation coefficient (R) of 0.162 and weighted average of 92.8%, a difference of 9.9%.
12th Grade, No Diploma Correlation Summary
| Measurement | Salvadoran | Immigrants from Canada |
| Minimum | 58.8% | 78.1% |
| Maximum | 100.0% | 100.0% |
| Range | 41.2% | 21.9% |
| Mean | 80.4% | 93.7% |
| Median | 81.7% | 95.1% |
| Interquartile 25% (IQ1) | 76.4% | 91.9% |
| Interquartile 75% (IQ3) | 85.3% | 97.1% |
| Interquartile Range (IQR) | 8.9% | 5.2% |
| Standard Deviation (Sample) | 7.2% | 5.4% |
| Standard Deviation (Population) | 7.1% | 5.4% |
Similar Demographics by 12th Grade, No Diploma
Demographics Similar to Salvadorans by 12th Grade, No Diploma
In terms of 12th grade, no diploma, the demographic groups most similar to Salvadorans are Guatemalan (84.6%, a difference of 0.10%), Pima (84.6%, a difference of 0.14%), Tohono O'odham (84.7%, a difference of 0.27%), Mexican (84.1%, a difference of 0.41%), and Immigrants from Yemen (84.8%, a difference of 0.42%).
| Demographics | Rating | Rank | 12th Grade, No Diploma |
| Immigrants | Honduras | 0.0 /100 | #332 | Tragic 85.0% |
| Immigrants | Latin America | 0.0 /100 | #333 | Tragic 85.0% |
| Immigrants | Dominican Republic | 0.0 /100 | #334 | Tragic 84.9% |
| Immigrants | Yemen | 0.0 /100 | #335 | Tragic 84.8% |
| Tohono O'odham | 0.0 /100 | #336 | Tragic 84.7% |
| Pima | 0.0 /100 | #337 | Tragic 84.6% |
| Guatemalans | 0.0 /100 | #338 | Tragic 84.6% |
| Salvadorans | 0.0 /100 | #339 | Tragic 84.5% |
| Mexicans | 0.0 /100 | #340 | Tragic 84.1% |
| Immigrants | Guatemala | 0.0 /100 | #341 | Tragic 84.0% |
| Houma | 0.0 /100 | #342 | Tragic 83.7% |
| Immigrants | El Salvador | 0.0 /100 | #343 | Tragic 83.6% |
| Immigrants | Central America | 0.0 /100 | #344 | Tragic 83.0% |
| Spanish American Indians | 0.0 /100 | #345 | Tragic 82.9% |
| Yakama | 0.0 /100 | #346 | Tragic 82.5% |
Demographics Similar to Immigrants from Canada by 12th Grade, No Diploma
In terms of 12th grade, no diploma, the demographic groups most similar to Immigrants from Canada are Immigrants from Taiwan (92.8%, a difference of 0.020%), Welsh (92.8%, a difference of 0.030%), New Zealander (92.8%, a difference of 0.030%), Immigrants from North America (92.8%, a difference of 0.030%), and Slavic (92.8%, a difference of 0.030%).
| Demographics | Rating | Rank | 12th Grade, No Diploma |
| Tsimshian | 99.8 /100 | #50 | Exceptional 92.9% |
| Immigrants | Belgium | 99.8 /100 | #51 | Exceptional 92.9% |
| Immigrants | Sweden | 99.8 /100 | #52 | Exceptional 92.8% |
| Serbians | 99.7 /100 | #53 | Exceptional 92.8% |
| Hungarians | 99.7 /100 | #54 | Exceptional 92.8% |
| Welsh | 99.7 /100 | #55 | Exceptional 92.8% |
| New Zealanders | 99.7 /100 | #56 | Exceptional 92.8% |
| Immigrants | Canada | 99.7 /100 | #57 | Exceptional 92.8% |
| Immigrants | Taiwan | 99.7 /100 | #58 | Exceptional 92.8% |
| Immigrants | North America | 99.7 /100 | #59 | Exceptional 92.8% |
| Slavs | 99.7 /100 | #60 | Exceptional 92.8% |
| Immigrants | Japan | 99.7 /100 | #61 | Exceptional 92.8% |
| Ukrainians | 99.6 /100 | #62 | Exceptional 92.7% |
| Zimbabweans | 99.6 /100 | #63 | Exceptional 92.7% |
| Immigrants | Netherlands | 99.6 /100 | #64 | Exceptional 92.7% |