Salvadoran vs Immigrants from Sudan In Labor Force | Age 45-54
COMPARE
Salvadoran
Immigrants from Sudan
In Labor Force | Age 45-54
In Labor Force | Age 45-54 Comparison
Salvadorans
Immigrants from Sudan
82.0%
IN LABOR FORCE | AGE 45-54
1.7/ 100
METRIC RATING
234th/ 347
METRIC RANK
82.8%
IN LABOR FORCE | AGE 45-54
59.9/ 100
METRIC RATING
165th/ 347
METRIC RANK
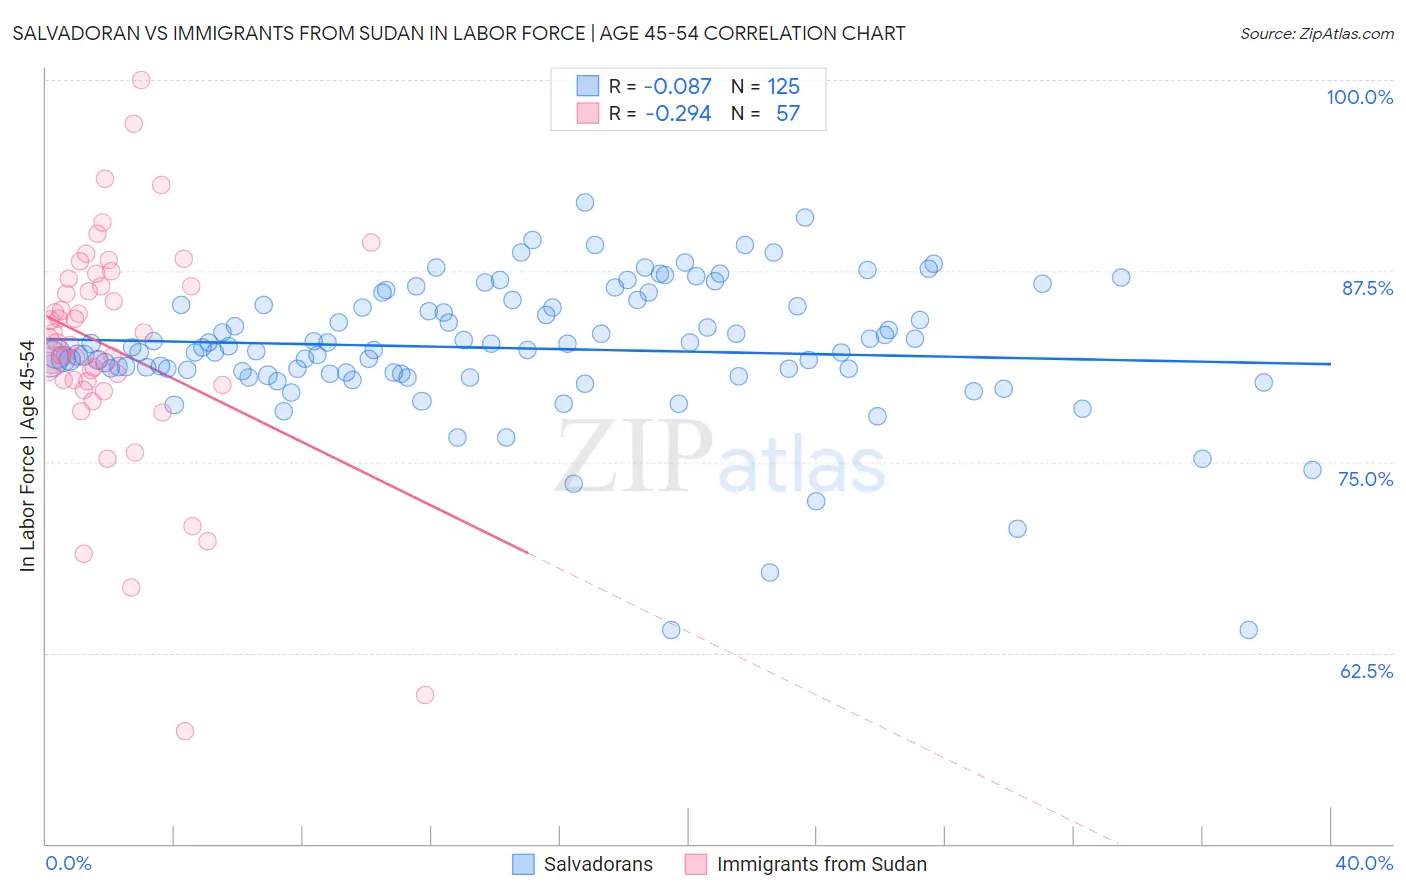
Salvadoran vs Immigrants from Sudan In Labor Force | Age 45-54 Correlation Chart
The statistical analysis conducted on geographies consisting of 398,682,111 people shows a slight negative correlation between the proportion of Salvadorans and labor force participation rate among population between the ages 45 and 54 in the United States with a correlation coefficient (R) of -0.087 and weighted average of 82.0%. Similarly, the statistical analysis conducted on geographies consisting of 118,941,177 people shows a weak negative correlation between the proportion of Immigrants from Sudan and labor force participation rate among population between the ages 45 and 54 in the United States with a correlation coefficient (R) of -0.294 and weighted average of 82.8%, a difference of 1.0%.
In Labor Force | Age 45-54 Correlation Summary
| Measurement | Salvadoran | Immigrants from Sudan |
| Minimum | 64.0% | 57.4% |
| Maximum | 92.0% | 100.0% |
| Range | 28.0% | 42.6% |
| Mean | 82.4% | 82.4% |
| Median | 82.4% | 82.8% |
| Interquartile 25% (IQ1) | 80.8% | 80.2% |
| Interquartile 75% (IQ3) | 85.3% | 86.8% |
| Interquartile Range (IQR) | 4.5% | 6.6% |
| Standard Deviation (Sample) | 4.5% | 7.7% |
| Standard Deviation (Population) | 4.5% | 7.6% |
Similar Demographics by In Labor Force | Age 45-54
Demographics Similar to Salvadorans by In Labor Force | Age 45-54
In terms of in labor force | age 45-54, the demographic groups most similar to Salvadorans are Immigrants from Portugal (82.0%, a difference of 0.0%), Malaysian (82.0%, a difference of 0.0%), Immigrants from Senegal (82.0%, a difference of 0.010%), Jamaican (82.0%, a difference of 0.020%), and Immigrants from Burma/Myanmar (82.0%, a difference of 0.030%).
| Demographics | Rating | Rank | In Labor Force | Age 45-54 |
| Immigrants | Germany | 2.4 /100 | #227 | Tragic 82.1% |
| Cape Verdeans | 2.1 /100 | #228 | Tragic 82.1% |
| Immigrants | Burma/Myanmar | 1.9 /100 | #229 | Tragic 82.0% |
| Jamaicans | 1.8 /100 | #230 | Tragic 82.0% |
| Immigrants | Senegal | 1.7 /100 | #231 | Tragic 82.0% |
| Immigrants | Portugal | 1.7 /100 | #232 | Tragic 82.0% |
| Malaysians | 1.7 /100 | #233 | Tragic 82.0% |
| Salvadorans | 1.7 /100 | #234 | Tragic 82.0% |
| Sub-Saharan Africans | 1.2 /100 | #235 | Tragic 82.0% |
| Basques | 1.2 /100 | #236 | Tragic 82.0% |
| Immigrants | Trinidad and Tobago | 1.2 /100 | #237 | Tragic 82.0% |
| Trinidadians and Tobagonians | 1.1 /100 | #238 | Tragic 81.9% |
| Immigrants | Thailand | 1.0 /100 | #239 | Tragic 81.9% |
| Immigrants | El Salvador | 1.0 /100 | #240 | Tragic 81.9% |
| Immigrants | Cambodia | 0.8 /100 | #241 | Tragic 81.9% |
Demographics Similar to Immigrants from Sudan by In Labor Force | Age 45-54
In terms of in labor force | age 45-54, the demographic groups most similar to Immigrants from Sudan are German Russian (82.8%, a difference of 0.010%), South American Indian (82.9%, a difference of 0.020%), Haitian (82.8%, a difference of 0.020%), Dutch (82.8%, a difference of 0.020%), and Immigrants from South Eastern Asia (82.8%, a difference of 0.020%).
| Demographics | Rating | Rank | In Labor Force | Age 45-54 |
| Immigrants | Southern Europe | 67.8 /100 | #158 | Good 82.9% |
| Immigrants | Austria | 64.6 /100 | #159 | Good 82.9% |
| Laotians | 62.8 /100 | #160 | Good 82.9% |
| South American Indians | 62.2 /100 | #161 | Good 82.9% |
| Haitians | 61.8 /100 | #162 | Good 82.8% |
| Dutch | 61.7 /100 | #163 | Good 82.8% |
| German Russians | 61.3 /100 | #164 | Good 82.8% |
| Immigrants | Sudan | 59.9 /100 | #165 | Average 82.8% |
| Immigrants | South Eastern Asia | 57.4 /100 | #166 | Average 82.8% |
| Swiss | 56.5 /100 | #167 | Average 82.8% |
| Immigrants | South Africa | 55.8 /100 | #168 | Average 82.8% |
| Immigrants | Western Africa | 54.1 /100 | #169 | Average 82.8% |
| Pakistanis | 53.2 /100 | #170 | Average 82.8% |
| Immigrants | Zaire | 52.9 /100 | #171 | Average 82.8% |
| Icelanders | 51.8 /100 | #172 | Average 82.8% |