Salvadoran vs Native/Alaskan In Labor Force | Age 45-54
COMPARE
Salvadoran
Native/Alaskan
In Labor Force | Age 45-54
In Labor Force | Age 45-54 Comparison
Salvadorans
Natives/Alaskans
82.0%
IN LABOR FORCE | AGE 45-54
1.7/ 100
METRIC RATING
234th/ 347
METRIC RANK
77.1%
IN LABOR FORCE | AGE 45-54
0.0/ 100
METRIC RATING
333rd/ 347
METRIC RANK
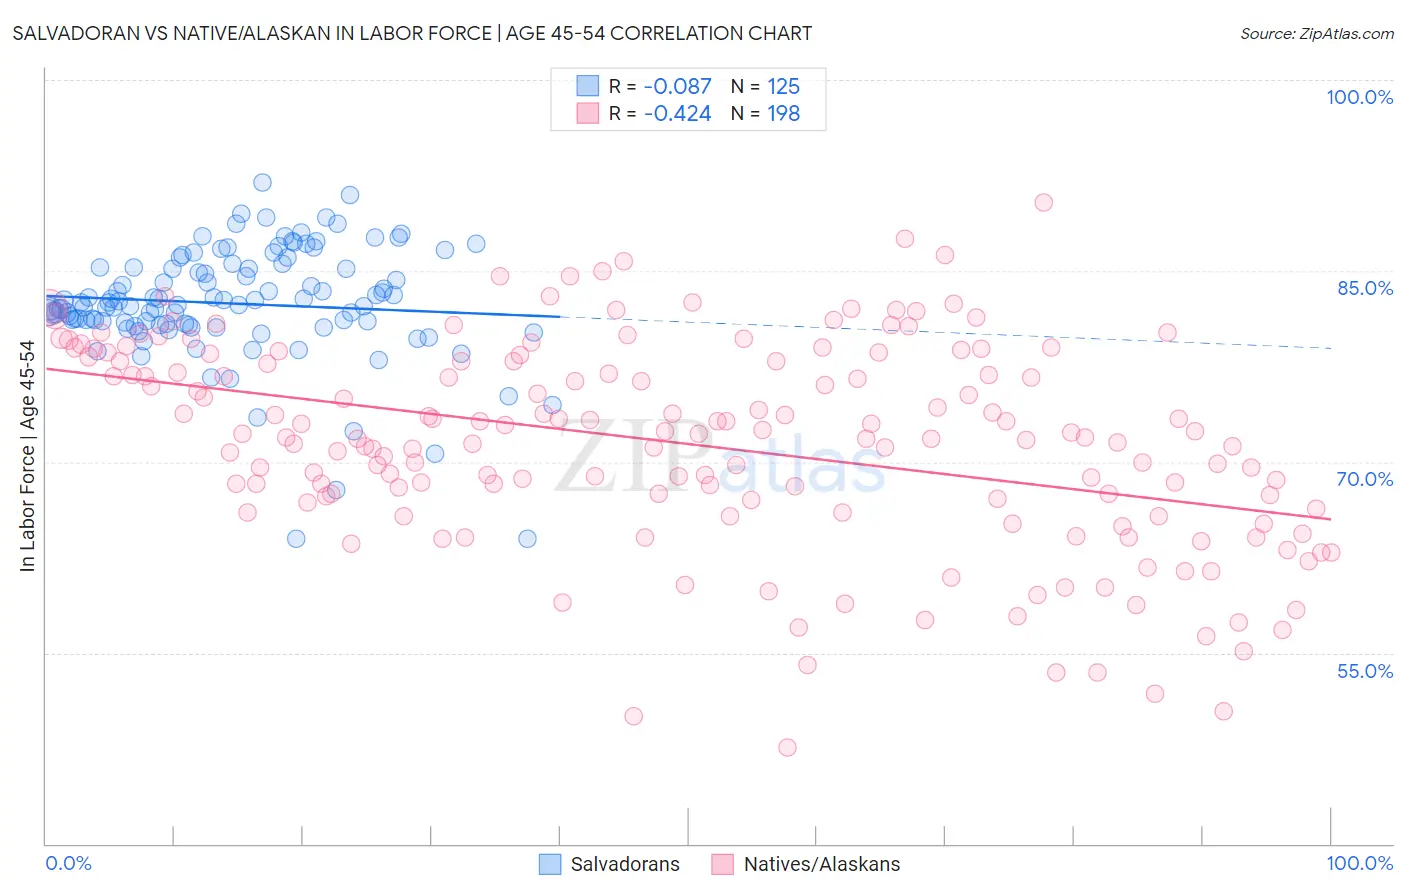
Salvadoran vs Native/Alaskan In Labor Force | Age 45-54 Correlation Chart
The statistical analysis conducted on geographies consisting of 398,682,111 people shows a slight negative correlation between the proportion of Salvadorans and labor force participation rate among population between the ages 45 and 54 in the United States with a correlation coefficient (R) of -0.087 and weighted average of 82.0%. Similarly, the statistical analysis conducted on geographies consisting of 512,575,279 people shows a moderate negative correlation between the proportion of Natives/Alaskans and labor force participation rate among population between the ages 45 and 54 in the United States with a correlation coefficient (R) of -0.424 and weighted average of 77.1%, a difference of 6.3%.
In Labor Force | Age 45-54 Correlation Summary
| Measurement | Salvadoran | Native/Alaskan |
| Minimum | 64.0% | 47.6% |
| Maximum | 92.0% | 90.4% |
| Range | 28.0% | 42.8% |
| Mean | 82.4% | 71.4% |
| Median | 82.4% | 72.0% |
| Interquartile 25% (IQ1) | 80.8% | 66.8% |
| Interquartile 75% (IQ3) | 85.3% | 77.9% |
| Interquartile Range (IQR) | 4.5% | 11.1% |
| Standard Deviation (Sample) | 4.5% | 8.1% |
| Standard Deviation (Population) | 4.5% | 8.1% |
Similar Demographics by In Labor Force | Age 45-54
Demographics Similar to Salvadorans by In Labor Force | Age 45-54
In terms of in labor force | age 45-54, the demographic groups most similar to Salvadorans are Immigrants from Portugal (82.0%, a difference of 0.0%), Malaysian (82.0%, a difference of 0.0%), Immigrants from Senegal (82.0%, a difference of 0.010%), Jamaican (82.0%, a difference of 0.020%), and Immigrants from Burma/Myanmar (82.0%, a difference of 0.030%).
| Demographics | Rating | Rank | In Labor Force | Age 45-54 |
| Immigrants | Germany | 2.4 /100 | #227 | Tragic 82.1% |
| Cape Verdeans | 2.1 /100 | #228 | Tragic 82.1% |
| Immigrants | Burma/Myanmar | 1.9 /100 | #229 | Tragic 82.0% |
| Jamaicans | 1.8 /100 | #230 | Tragic 82.0% |
| Immigrants | Senegal | 1.7 /100 | #231 | Tragic 82.0% |
| Immigrants | Portugal | 1.7 /100 | #232 | Tragic 82.0% |
| Malaysians | 1.7 /100 | #233 | Tragic 82.0% |
| Salvadorans | 1.7 /100 | #234 | Tragic 82.0% |
| Sub-Saharan Africans | 1.2 /100 | #235 | Tragic 82.0% |
| Basques | 1.2 /100 | #236 | Tragic 82.0% |
| Immigrants | Trinidad and Tobago | 1.2 /100 | #237 | Tragic 82.0% |
| Trinidadians and Tobagonians | 1.1 /100 | #238 | Tragic 81.9% |
| Immigrants | Thailand | 1.0 /100 | #239 | Tragic 81.9% |
| Immigrants | El Salvador | 1.0 /100 | #240 | Tragic 81.9% |
| Immigrants | Cambodia | 0.8 /100 | #241 | Tragic 81.9% |
Demographics Similar to Natives/Alaskans by In Labor Force | Age 45-54
In terms of in labor force | age 45-54, the demographic groups most similar to Natives/Alaskans are Apache (77.1%, a difference of 0.0%), Arapaho (77.1%, a difference of 0.070%), Menominee (77.4%, a difference of 0.36%), Tsimshian (77.4%, a difference of 0.39%), and Cheyenne (77.6%, a difference of 0.54%).
| Demographics | Rating | Rank | In Labor Force | Age 45-54 |
| Seminole | 0.0 /100 | #326 | Tragic 78.1% |
| Cajuns | 0.0 /100 | #327 | Tragic 78.1% |
| Sioux | 0.0 /100 | #328 | Tragic 78.0% |
| Creek | 0.0 /100 | #329 | Tragic 77.7% |
| Cheyenne | 0.0 /100 | #330 | Tragic 77.6% |
| Tsimshian | 0.0 /100 | #331 | Tragic 77.4% |
| Menominee | 0.0 /100 | #332 | Tragic 77.4% |
| Natives/Alaskans | 0.0 /100 | #333 | Tragic 77.1% |
| Apache | 0.0 /100 | #334 | Tragic 77.1% |
| Arapaho | 0.0 /100 | #335 | Tragic 77.1% |
| Paiute | 0.0 /100 | #336 | Tragic 76.7% |
| Ute | 0.0 /100 | #337 | Tragic 76.6% |
| Yuman | 0.0 /100 | #338 | Tragic 76.3% |
| Puerto Ricans | 0.0 /100 | #339 | Tragic 75.9% |
| Lumbee | 0.0 /100 | #340 | Tragic 75.6% |