Salvadoran vs Immigrants from Zimbabwe In Labor Force | Age 45-54
COMPARE
Salvadoran
Immigrants from Zimbabwe
In Labor Force | Age 45-54
In Labor Force | Age 45-54 Comparison
Salvadorans
Immigrants from Zimbabwe
82.0%
IN LABOR FORCE | AGE 45-54
1.7/ 100
METRIC RATING
234th/ 347
METRIC RANK
83.4%
IN LABOR FORCE | AGE 45-54
96.3/ 100
METRIC RATING
83rd/ 347
METRIC RANK
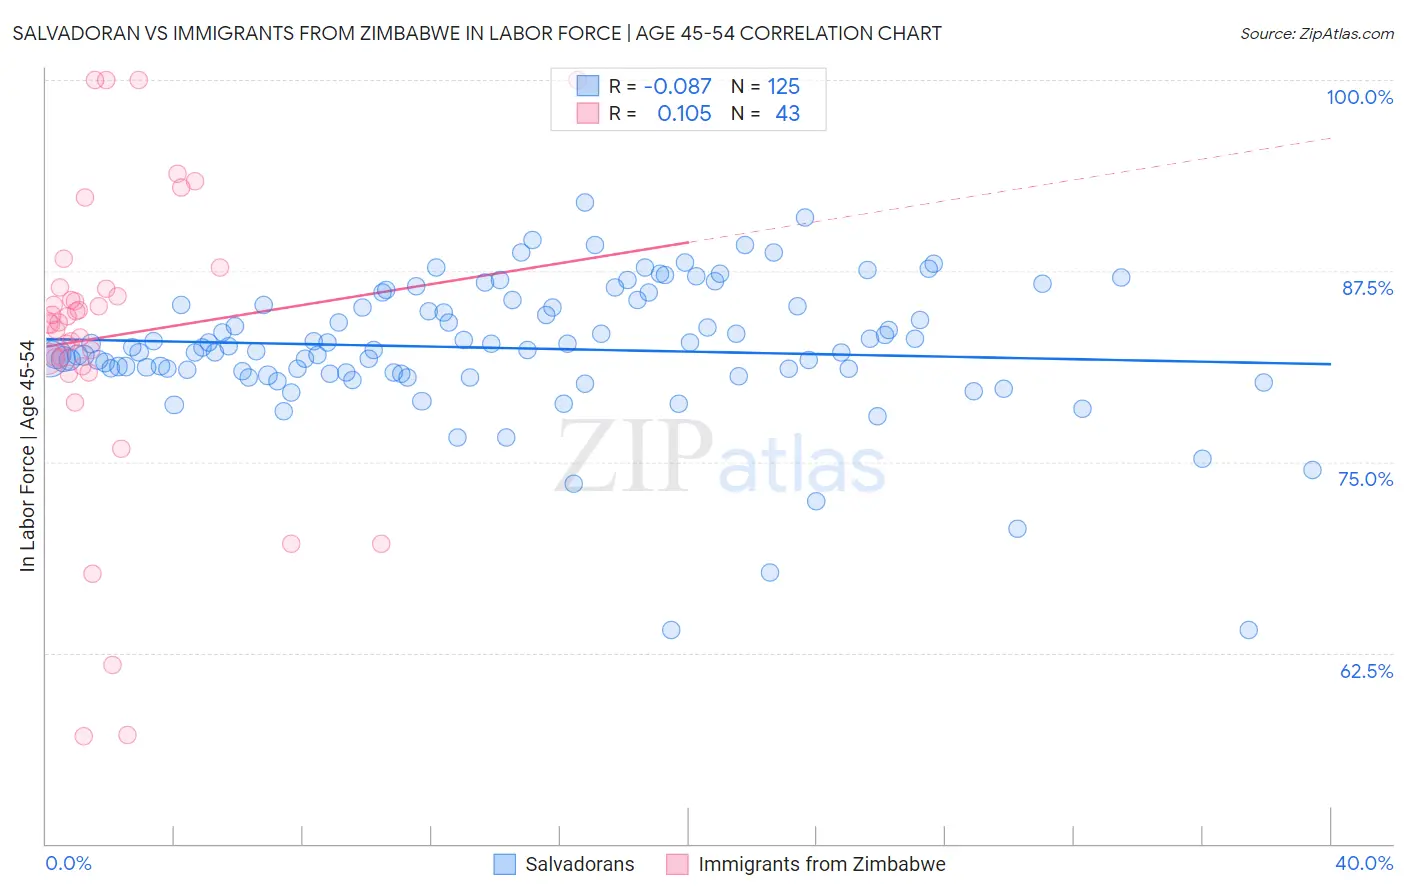
Salvadoran vs Immigrants from Zimbabwe In Labor Force | Age 45-54 Correlation Chart
The statistical analysis conducted on geographies consisting of 398,682,111 people shows a slight negative correlation between the proportion of Salvadorans and labor force participation rate among population between the ages 45 and 54 in the United States with a correlation coefficient (R) of -0.087 and weighted average of 82.0%. Similarly, the statistical analysis conducted on geographies consisting of 117,788,320 people shows a poor positive correlation between the proportion of Immigrants from Zimbabwe and labor force participation rate among population between the ages 45 and 54 in the United States with a correlation coefficient (R) of 0.105 and weighted average of 83.4%, a difference of 1.6%.
In Labor Force | Age 45-54 Correlation Summary
| Measurement | Salvadoran | Immigrants from Zimbabwe |
| Minimum | 64.0% | 57.0% |
| Maximum | 92.0% | 100.0% |
| Range | 28.0% | 43.0% |
| Mean | 82.4% | 83.3% |
| Median | 82.4% | 84.1% |
| Interquartile 25% (IQ1) | 80.8% | 81.2% |
| Interquartile 75% (IQ3) | 85.3% | 86.4% |
| Interquartile Range (IQR) | 4.5% | 5.1% |
| Standard Deviation (Sample) | 4.5% | 10.0% |
| Standard Deviation (Population) | 4.5% | 9.8% |
Similar Demographics by In Labor Force | Age 45-54
Demographics Similar to Salvadorans by In Labor Force | Age 45-54
In terms of in labor force | age 45-54, the demographic groups most similar to Salvadorans are Immigrants from Portugal (82.0%, a difference of 0.0%), Malaysian (82.0%, a difference of 0.0%), Immigrants from Senegal (82.0%, a difference of 0.010%), Jamaican (82.0%, a difference of 0.020%), and Immigrants from Burma/Myanmar (82.0%, a difference of 0.030%).
| Demographics | Rating | Rank | In Labor Force | Age 45-54 |
| Immigrants | Germany | 2.4 /100 | #227 | Tragic 82.1% |
| Cape Verdeans | 2.1 /100 | #228 | Tragic 82.1% |
| Immigrants | Burma/Myanmar | 1.9 /100 | #229 | Tragic 82.0% |
| Jamaicans | 1.8 /100 | #230 | Tragic 82.0% |
| Immigrants | Senegal | 1.7 /100 | #231 | Tragic 82.0% |
| Immigrants | Portugal | 1.7 /100 | #232 | Tragic 82.0% |
| Malaysians | 1.7 /100 | #233 | Tragic 82.0% |
| Salvadorans | 1.7 /100 | #234 | Tragic 82.0% |
| Sub-Saharan Africans | 1.2 /100 | #235 | Tragic 82.0% |
| Basques | 1.2 /100 | #236 | Tragic 82.0% |
| Immigrants | Trinidad and Tobago | 1.2 /100 | #237 | Tragic 82.0% |
| Trinidadians and Tobagonians | 1.1 /100 | #238 | Tragic 81.9% |
| Immigrants | Thailand | 1.0 /100 | #239 | Tragic 81.9% |
| Immigrants | El Salvador | 1.0 /100 | #240 | Tragic 81.9% |
| Immigrants | Cambodia | 0.8 /100 | #241 | Tragic 81.9% |
Demographics Similar to Immigrants from Zimbabwe by In Labor Force | Age 45-54
In terms of in labor force | age 45-54, the demographic groups most similar to Immigrants from Zimbabwe are Immigrants from Eastern Asia (83.4%, a difference of 0.0%), Immigrants from Croatia (83.4%, a difference of 0.010%), Jordanian (83.4%, a difference of 0.010%), Immigrants from Bosnia and Herzegovina (83.3%, a difference of 0.010%), and Immigrants from Egypt (83.4%, a difference of 0.020%).
| Demographics | Rating | Rank | In Labor Force | Age 45-54 |
| Russians | 96.8 /100 | #76 | Exceptional 83.4% |
| Cubans | 96.7 /100 | #77 | Exceptional 83.4% |
| Immigrants | Egypt | 96.6 /100 | #78 | Exceptional 83.4% |
| Belgians | 96.5 /100 | #79 | Exceptional 83.4% |
| Immigrants | Croatia | 96.5 /100 | #80 | Exceptional 83.4% |
| Jordanians | 96.4 /100 | #81 | Exceptional 83.4% |
| Immigrants | Eastern Asia | 96.3 /100 | #82 | Exceptional 83.4% |
| Immigrants | Zimbabwe | 96.3 /100 | #83 | Exceptional 83.4% |
| Immigrants | Bosnia and Herzegovina | 96.0 /100 | #84 | Exceptional 83.3% |
| Greeks | 95.9 /100 | #85 | Exceptional 83.3% |
| Immigrants | Northern Africa | 95.7 /100 | #86 | Exceptional 83.3% |
| Immigrants | Eastern Europe | 95.6 /100 | #87 | Exceptional 83.3% |
| Immigrants | Asia | 95.6 /100 | #88 | Exceptional 83.3% |
| Indians (Asian) | 95.5 /100 | #89 | Exceptional 83.3% |
| Immigrants | Japan | 95.5 /100 | #90 | Exceptional 83.3% |