Scottish vs Immigrants from St. Vincent and the Grenadines In Labor Force | Age 45-54
COMPARE
Scottish
Immigrants from St. Vincent and the Grenadines
In Labor Force | Age 45-54
In Labor Force | Age 45-54 Comparison
Scottish
Immigrants from St. Vincent and the Grenadines
82.2%
IN LABOR FORCE | AGE 45-54
5.3/ 100
METRIC RATING
216th/ 347
METRIC RANK
81.4%
IN LABOR FORCE | AGE 45-54
0.1/ 100
METRIC RATING
266th/ 347
METRIC RANK
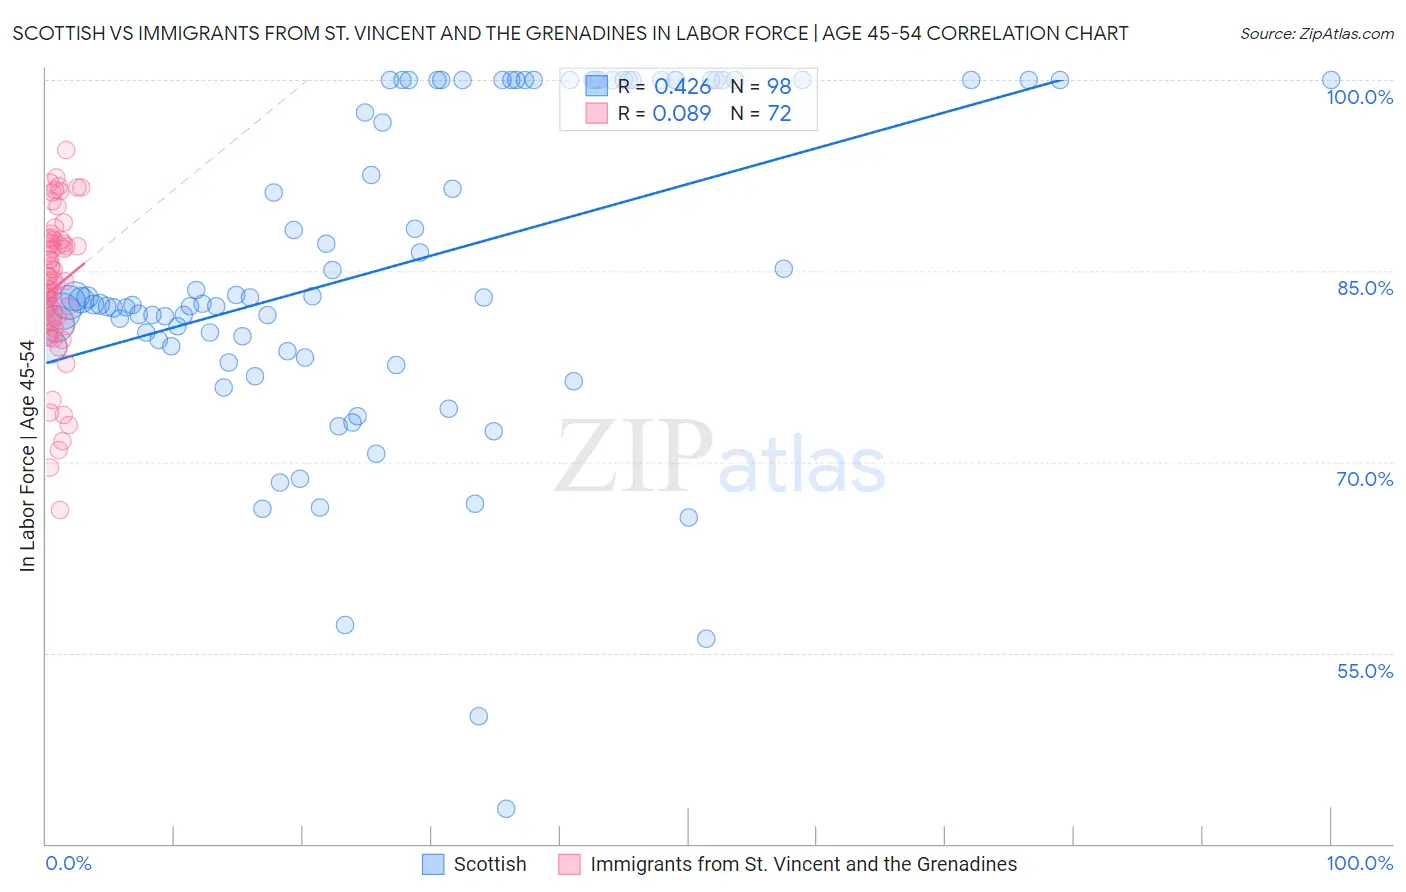
Scottish vs Immigrants from St. Vincent and the Grenadines In Labor Force | Age 45-54 Correlation Chart
The statistical analysis conducted on geographies consisting of 566,392,966 people shows a moderate positive correlation between the proportion of Scottish and labor force participation rate among population between the ages 45 and 54 in the United States with a correlation coefficient (R) of 0.426 and weighted average of 82.2%. Similarly, the statistical analysis conducted on geographies consisting of 56,188,092 people shows a slight positive correlation between the proportion of Immigrants from St. Vincent and the Grenadines and labor force participation rate among population between the ages 45 and 54 in the United States with a correlation coefficient (R) of 0.089 and weighted average of 81.4%, a difference of 1.1%.
In Labor Force | Age 45-54 Correlation Summary
| Measurement | Scottish | Immigrants from St. Vincent and the Grenadines |
| Minimum | 42.8% | 66.2% |
| Maximum | 100.0% | 94.5% |
| Range | 57.2% | 28.3% |
| Mean | 85.4% | 83.7% |
| Median | 82.8% | 84.3% |
| Interquartile 25% (IQ1) | 79.1% | 80.9% |
| Interquartile 75% (IQ3) | 100.0% | 87.3% |
| Interquartile Range (IQR) | 20.9% | 6.4% |
| Standard Deviation (Sample) | 12.7% | 5.7% |
| Standard Deviation (Population) | 12.7% | 5.7% |
Similar Demographics by In Labor Force | Age 45-54
Demographics Similar to Scottish by In Labor Force | Age 45-54
In terms of in labor force | age 45-54, the demographic groups most similar to Scottish are Immigrants from Panama (82.2%, a difference of 0.010%), Iraqi (82.2%, a difference of 0.010%), Immigrants from Uzbekistan (82.3%, a difference of 0.020%), Portuguese (82.2%, a difference of 0.030%), and Ecuadorian (82.3%, a difference of 0.040%).
| Demographics | Rating | Rank | In Labor Force | Age 45-54 |
| Immigrants | Lebanon | 7.4 /100 | #209 | Tragic 82.3% |
| Immigrants | Bahamas | 7.1 /100 | #210 | Tragic 82.3% |
| Immigrants | Syria | 6.6 /100 | #211 | Tragic 82.3% |
| Ecuadorians | 6.3 /100 | #212 | Tragic 82.3% |
| Immigrants | Uzbekistan | 5.8 /100 | #213 | Tragic 82.3% |
| Immigrants | Panama | 5.6 /100 | #214 | Tragic 82.2% |
| Iraqis | 5.6 /100 | #215 | Tragic 82.2% |
| Scottish | 5.3 /100 | #216 | Tragic 82.2% |
| Portuguese | 4.7 /100 | #217 | Tragic 82.2% |
| English | 4.4 /100 | #218 | Tragic 82.2% |
| French | 4.1 /100 | #219 | Tragic 82.2% |
| Bahamians | 3.6 /100 | #220 | Tragic 82.2% |
| Panamanians | 3.5 /100 | #221 | Tragic 82.2% |
| Immigrants | Ecuador | 3.4 /100 | #222 | Tragic 82.2% |
| Immigrants | Immigrants | 3.1 /100 | #223 | Tragic 82.1% |
Demographics Similar to Immigrants from St. Vincent and the Grenadines by In Labor Force | Age 45-54
In terms of in labor force | age 45-54, the demographic groups most similar to Immigrants from St. Vincent and the Grenadines are West Indian (81.4%, a difference of 0.0%), Immigrants from Honduras (81.4%, a difference of 0.030%), Alsatian (81.3%, a difference of 0.050%), Honduran (81.4%, a difference of 0.080%), and Bangladeshi (81.3%, a difference of 0.080%).
| Demographics | Rating | Rank | In Labor Force | Age 45-54 |
| Guyanese | 0.1 /100 | #259 | Tragic 81.5% |
| Spaniards | 0.1 /100 | #260 | Tragic 81.5% |
| Hawaiians | 0.1 /100 | #261 | Tragic 81.5% |
| Immigrants | Guyana | 0.1 /100 | #262 | Tragic 81.5% |
| Indonesians | 0.1 /100 | #263 | Tragic 81.5% |
| Immigrants | West Indies | 0.1 /100 | #264 | Tragic 81.5% |
| Hondurans | 0.1 /100 | #265 | Tragic 81.4% |
| Immigrants | St. Vincent and the Grenadines | 0.1 /100 | #266 | Tragic 81.4% |
| West Indians | 0.1 /100 | #267 | Tragic 81.4% |
| Immigrants | Honduras | 0.0 /100 | #268 | Tragic 81.4% |
| Alsatians | 0.0 /100 | #269 | Tragic 81.3% |
| Bangladeshis | 0.0 /100 | #270 | Tragic 81.3% |
| Immigrants | Barbados | 0.0 /100 | #271 | Tragic 81.3% |
| Spanish | 0.0 /100 | #272 | Tragic 81.3% |
| Chippewa | 0.0 /100 | #273 | Tragic 81.3% |