Pueblo vs Immigrants from Micronesia In Labor Force | Age 30-34
COMPARE
Pueblo
Immigrants from Micronesia
In Labor Force | Age 30-34
In Labor Force | Age 30-34 Comparison
Pueblo
Immigrants from Micronesia
80.0%
IN LABOR FORCE | AGE 30-34
0.0/ 100
METRIC RATING
330th/ 347
METRIC RANK
82.4%
IN LABOR FORCE | AGE 30-34
0.0/ 100
METRIC RATING
303rd/ 347
METRIC RANK
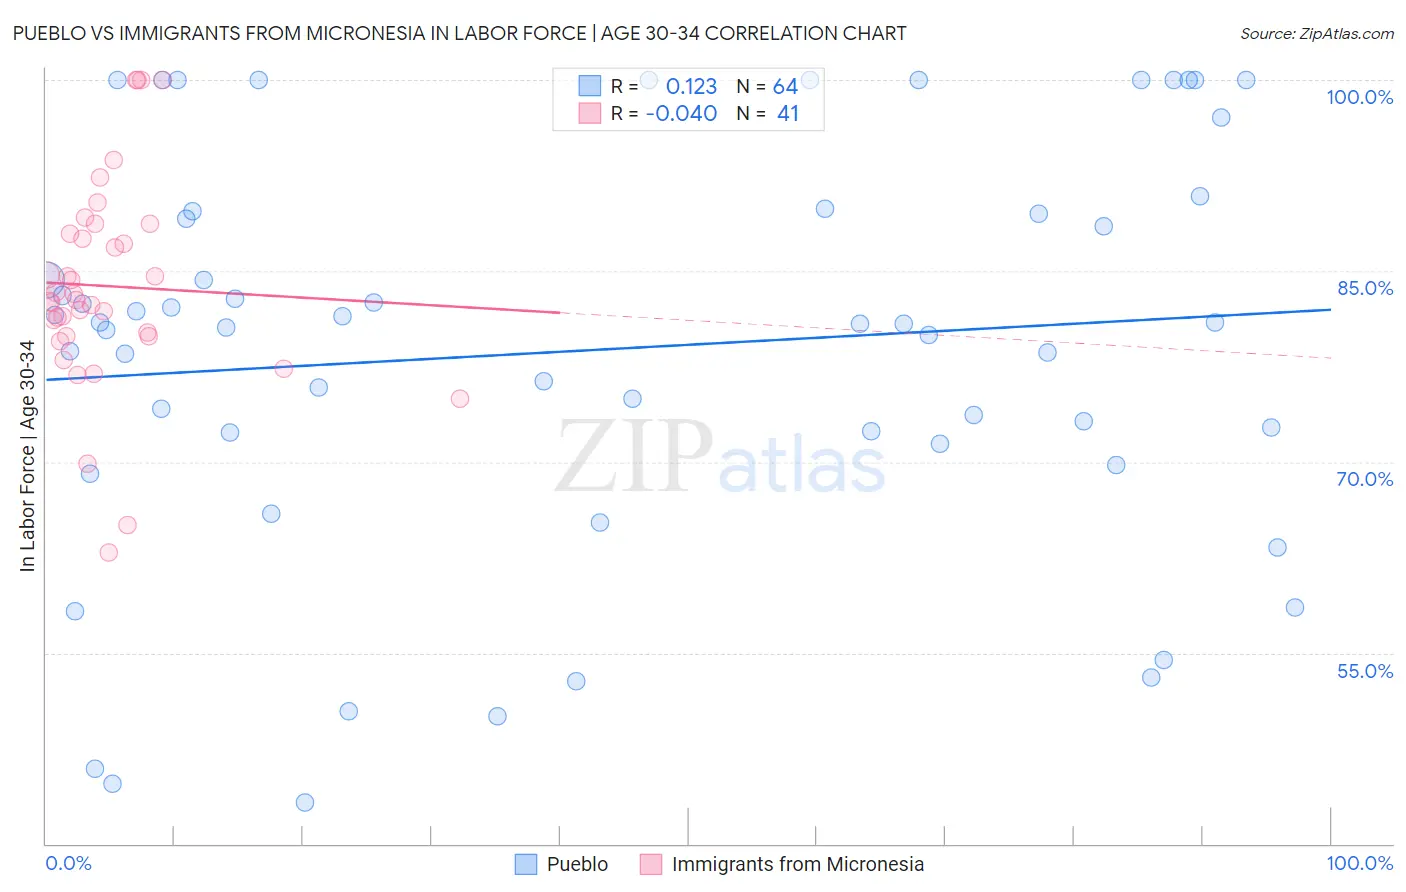
Pueblo vs Immigrants from Micronesia In Labor Force | Age 30-34 Correlation Chart
The statistical analysis conducted on geographies consisting of 120,059,209 people shows a poor positive correlation between the proportion of Pueblo and labor force participation rate among population between the ages 30 and 34 in the United States with a correlation coefficient (R) of 0.123 and weighted average of 80.0%. Similarly, the statistical analysis conducted on geographies consisting of 61,597,268 people shows no correlation between the proportion of Immigrants from Micronesia and labor force participation rate among population between the ages 30 and 34 in the United States with a correlation coefficient (R) of -0.040 and weighted average of 82.4%, a difference of 2.9%.
In Labor Force | Age 30-34 Correlation Summary
| Measurement | Pueblo | Immigrants from Micronesia |
| Minimum | 43.2% | 62.9% |
| Maximum | 100.0% | 100.0% |
| Range | 56.8% | 37.1% |
| Mean | 78.8% | 83.8% |
| Median | 80.9% | 82.7% |
| Interquartile 25% (IQ1) | 71.9% | 79.9% |
| Interquartile 75% (IQ3) | 89.6% | 88.3% |
| Interquartile Range (IQR) | 17.8% | 8.4% |
| Standard Deviation (Sample) | 15.7% | 8.3% |
| Standard Deviation (Population) | 15.6% | 8.1% |
Similar Demographics by In Labor Force | Age 30-34
Demographics Similar to Pueblo by In Labor Force | Age 30-34
In terms of in labor force | age 30-34, the demographic groups most similar to Pueblo are Houma (79.9%, a difference of 0.17%), Kiowa (79.8%, a difference of 0.28%), Creek (80.4%, a difference of 0.40%), Inupiat (79.7%, a difference of 0.40%), and Sioux (80.4%, a difference of 0.41%).
| Demographics | Rating | Rank | In Labor Force | Age 30-34 |
| Paiute | 0.0 /100 | #323 | Tragic 81.2% |
| Cheyenne | 0.0 /100 | #324 | Tragic 81.1% |
| Dutch West Indians | 0.0 /100 | #325 | Tragic 81.0% |
| Seminole | 0.0 /100 | #326 | Tragic 80.8% |
| Colville | 0.0 /100 | #327 | Tragic 80.7% |
| Sioux | 0.0 /100 | #328 | Tragic 80.4% |
| Creek | 0.0 /100 | #329 | Tragic 80.4% |
| Pueblo | 0.0 /100 | #330 | Tragic 80.0% |
| Houma | 0.0 /100 | #331 | Tragic 79.9% |
| Kiowa | 0.0 /100 | #332 | Tragic 79.8% |
| Inupiat | 0.0 /100 | #333 | Tragic 79.7% |
| Hopi | 0.0 /100 | #334 | Tragic 79.3% |
| Marshallese | 0.0 /100 | #335 | Tragic 79.2% |
| Natives/Alaskans | 0.0 /100 | #336 | Tragic 79.2% |
| Yakama | 0.0 /100 | #337 | Tragic 79.1% |
Demographics Similar to Immigrants from Micronesia by In Labor Force | Age 30-34
In terms of in labor force | age 30-34, the demographic groups most similar to Immigrants from Micronesia are Ottawa (82.4%, a difference of 0.010%), Hispanic or Latino (82.4%, a difference of 0.040%), Hmong (82.4%, a difference of 0.050%), Tlingit-Haida (82.3%, a difference of 0.080%), and Immigrants from Central America (82.5%, a difference of 0.11%).
| Demographics | Rating | Rank | In Labor Force | Age 30-34 |
| Chippewa | 0.0 /100 | #296 | Tragic 82.6% |
| Comanche | 0.0 /100 | #297 | Tragic 82.6% |
| Aleuts | 0.0 /100 | #298 | Tragic 82.6% |
| Immigrants | Central America | 0.0 /100 | #299 | Tragic 82.5% |
| Hmong | 0.0 /100 | #300 | Tragic 82.4% |
| Hispanics or Latinos | 0.0 /100 | #301 | Tragic 82.4% |
| Ottawa | 0.0 /100 | #302 | Tragic 82.4% |
| Immigrants | Micronesia | 0.0 /100 | #303 | Tragic 82.4% |
| Tlingit-Haida | 0.0 /100 | #304 | Tragic 82.3% |
| Osage | 0.0 /100 | #305 | Tragic 82.3% |
| Spanish American Indians | 0.0 /100 | #306 | Tragic 82.2% |
| Menominee | 0.0 /100 | #307 | Tragic 82.2% |
| Puget Sound Salish | 0.0 /100 | #308 | Tragic 82.1% |
| Immigrants | Mexico | 0.0 /100 | #309 | Tragic 82.0% |
| Cajuns | 0.0 /100 | #310 | Tragic 82.0% |