Scottish vs Immigrants from Albania In Labor Force | Age 16-19
COMPARE
Scottish
Immigrants from Albania
In Labor Force | Age 16-19
In Labor Force | Age 16-19 Comparison
Scottish
Immigrants from Albania
42.0%
IN LABOR FORCE | AGE 16-19
100.0/ 100
METRIC RATING
30th/ 347
METRIC RANK
35.8%
IN LABOR FORCE | AGE 16-19
15.0/ 100
METRIC RATING
204th/ 347
METRIC RANK
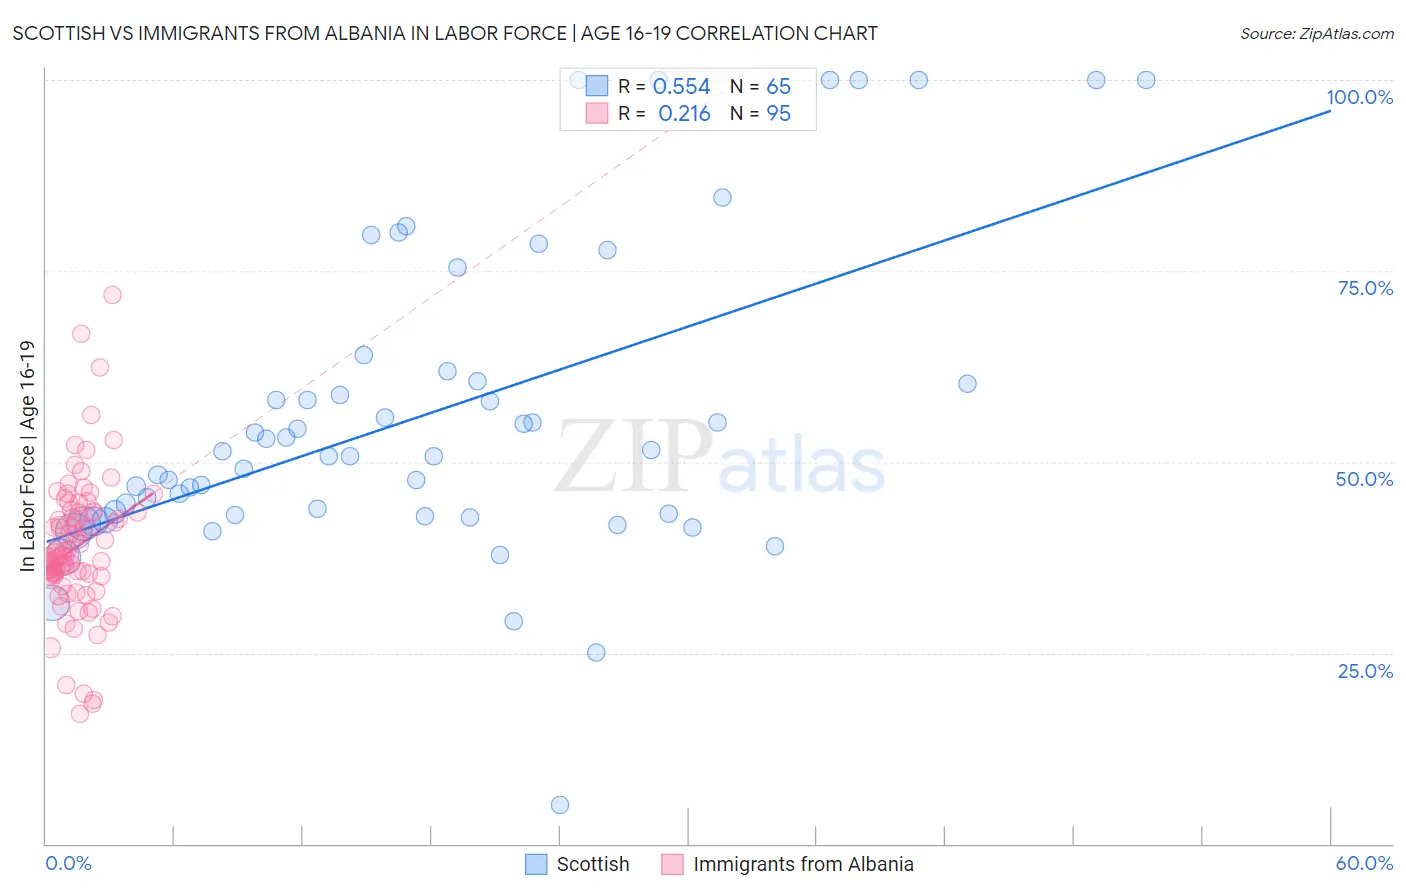
Scottish vs Immigrants from Albania In Labor Force | Age 16-19 Correlation Chart
The statistical analysis conducted on geographies consisting of 562,983,292 people shows a substantial positive correlation between the proportion of Scottish and labor force participation rate among population between the ages 16 and 19 in the United States with a correlation coefficient (R) of 0.554 and weighted average of 42.0%. Similarly, the statistical analysis conducted on geographies consisting of 119,330,257 people shows a weak positive correlation between the proportion of Immigrants from Albania and labor force participation rate among population between the ages 16 and 19 in the United States with a correlation coefficient (R) of 0.216 and weighted average of 35.8%, a difference of 17.4%.
In Labor Force | Age 16-19 Correlation Summary
| Measurement | Scottish | Immigrants from Albania |
| Minimum | 5.0% | 17.1% |
| Maximum | 100.0% | 71.9% |
| Range | 95.0% | 54.8% |
| Mean | 56.2% | 38.8% |
| Median | 50.8% | 37.7% |
| Interquartile 25% (IQ1) | 42.9% | 35.1% |
| Interquartile 75% (IQ3) | 61.2% | 43.4% |
| Interquartile Range (IQR) | 18.3% | 8.3% |
| Standard Deviation (Sample) | 20.5% | 9.0% |
| Standard Deviation (Population) | 20.4% | 9.0% |
Similar Demographics by In Labor Force | Age 16-19
Demographics Similar to Scottish by In Labor Force | Age 16-19
In terms of in labor force | age 16-19, the demographic groups most similar to Scottish are Irish (42.0%, a difference of 0.070%), Czechoslovakian (41.9%, a difference of 0.27%), French (42.1%, a difference of 0.28%), Polish (42.1%, a difference of 0.33%), and Liberian (41.8%, a difference of 0.41%).
| Demographics | Rating | Rank | In Labor Force | Age 16-19 |
| Slovaks | 100.0 /100 | #23 | Exceptional 42.6% |
| Bangladeshis | 100.0 /100 | #24 | Exceptional 42.5% |
| German Russians | 100.0 /100 | #25 | Exceptional 42.4% |
| English | 100.0 /100 | #26 | Exceptional 42.4% |
| Welsh | 100.0 /100 | #27 | Exceptional 42.3% |
| Poles | 100.0 /100 | #28 | Exceptional 42.1% |
| French | 100.0 /100 | #29 | Exceptional 42.1% |
| Scottish | 100.0 /100 | #30 | Exceptional 42.0% |
| Irish | 100.0 /100 | #31 | Exceptional 42.0% |
| Czechoslovakians | 100.0 /100 | #32 | Exceptional 41.9% |
| Liberians | 100.0 /100 | #33 | Exceptional 41.8% |
| Immigrants | Bosnia and Herzegovina | 100.0 /100 | #34 | Exceptional 41.8% |
| Yugoslavians | 100.0 /100 | #35 | Exceptional 41.8% |
| Immigrants | Azores | 100.0 /100 | #36 | Exceptional 41.7% |
| Immigrants | Congo | 100.0 /100 | #37 | Exceptional 41.7% |
Demographics Similar to Immigrants from Albania by In Labor Force | Age 16-19
In terms of in labor force | age 16-19, the demographic groups most similar to Immigrants from Albania are South American Indian (35.8%, a difference of 0.040%), Chilean (35.8%, a difference of 0.040%), Immigrants from Eastern Europe (35.8%, a difference of 0.050%), Immigrants from Nigeria (35.8%, a difference of 0.17%), and Korean (35.7%, a difference of 0.17%).
| Demographics | Rating | Rank | In Labor Force | Age 16-19 |
| Immigrants | Serbia | 21.0 /100 | #197 | Fair 36.0% |
| Immigrants | Northern Africa | 19.9 /100 | #198 | Poor 35.9% |
| Immigrants | Norway | 19.8 /100 | #199 | Poor 35.9% |
| Immigrants | Sweden | 18.8 /100 | #200 | Poor 35.9% |
| Alsatians | 17.5 /100 | #201 | Poor 35.9% |
| Senegalese | 17.4 /100 | #202 | Poor 35.9% |
| Immigrants | Nigeria | 16.8 /100 | #203 | Poor 35.8% |
| Immigrants | Albania | 15.0 /100 | #204 | Poor 35.8% |
| South American Indians | 14.6 /100 | #205 | Poor 35.8% |
| Chileans | 14.6 /100 | #206 | Poor 35.8% |
| Immigrants | Eastern Europe | 14.5 /100 | #207 | Poor 35.8% |
| Koreans | 13.3 /100 | #208 | Poor 35.7% |
| Moroccans | 12.7 /100 | #209 | Poor 35.7% |
| Immigrants | Switzerland | 11.9 /100 | #210 | Poor 35.6% |
| Mexicans | 11.9 /100 | #211 | Poor 35.6% |