Immigrants from the Azores vs Native/Alaskan In Labor Force | Age > 16
COMPARE
Immigrants from the Azores
Native/Alaskan
In Labor Force | Age > 16
In Labor Force | Age > 16 Comparison
Immigrants from the Azores
Natives/Alaskans
63.6%
IN LABOR FORCE | AGE > 16
0.0/ 100
METRIC RATING
300th/ 347
METRIC RANK
60.6%
IN LABOR FORCE | AGE > 16
0.0/ 100
METRIC RATING
335th/ 347
METRIC RANK
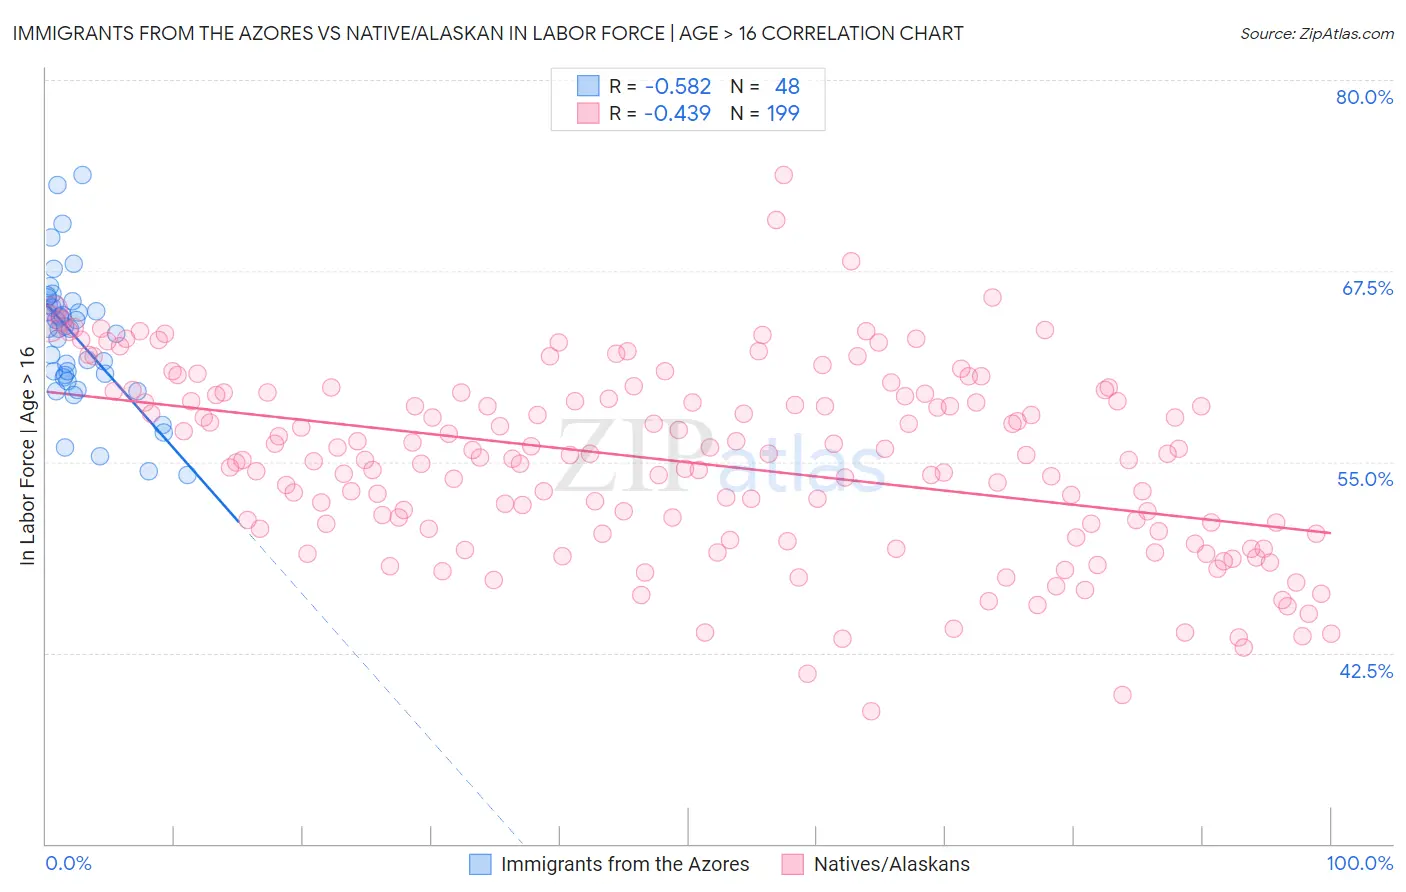
Immigrants from the Azores vs Native/Alaskan In Labor Force | Age > 16 Correlation Chart
The statistical analysis conducted on geographies consisting of 46,256,974 people shows a substantial negative correlation between the proportion of Immigrants from the Azores and labor force participation rate among population ages 16 and over in the United States with a correlation coefficient (R) of -0.582 and weighted average of 63.6%. Similarly, the statistical analysis conducted on geographies consisting of 513,032,279 people shows a moderate negative correlation between the proportion of Natives/Alaskans and labor force participation rate among population ages 16 and over in the United States with a correlation coefficient (R) of -0.439 and weighted average of 60.6%, a difference of 5.0%.
In Labor Force | Age > 16 Correlation Summary
| Measurement | Immigrants from the Azores | Native/Alaskan |
| Minimum | 54.1% | 38.7% |
| Maximum | 73.8% | 73.8% |
| Range | 19.7% | 35.1% |
| Mean | 63.1% | 55.0% |
| Median | 63.7% | 55.3% |
| Interquartile 25% (IQ1) | 60.6% | 50.5% |
| Interquartile 75% (IQ3) | 65.3% | 59.3% |
| Interquartile Range (IQR) | 4.7% | 8.9% |
| Standard Deviation (Sample) | 4.3% | 6.1% |
| Standard Deviation (Population) | 4.2% | 6.1% |
Similar Demographics by In Labor Force | Age > 16
Demographics Similar to Immigrants from the Azores by In Labor Force | Age > 16
In terms of in labor force | age > 16, the demographic groups most similar to Immigrants from the Azores are White/Caucasian (63.6%, a difference of 0.010%), Spanish American (63.6%, a difference of 0.030%), Delaware (63.6%, a difference of 0.040%), Comanche (63.6%, a difference of 0.060%), and Immigrants from Grenada (63.6%, a difference of 0.070%).
| Demographics | Rating | Rank | In Labor Force | Age > 16 |
| English | 0.1 /100 | #293 | Tragic 63.7% |
| Puget Sound Salish | 0.0 /100 | #294 | Tragic 63.7% |
| Immigrants | Canada | 0.0 /100 | #295 | Tragic 63.7% |
| Immigrants | North America | 0.0 /100 | #296 | Tragic 63.7% |
| Immigrants | Grenada | 0.0 /100 | #297 | Tragic 63.6% |
| Comanche | 0.0 /100 | #298 | Tragic 63.6% |
| Whites/Caucasians | 0.0 /100 | #299 | Tragic 63.6% |
| Immigrants | Azores | 0.0 /100 | #300 | Tragic 63.6% |
| Spanish Americans | 0.0 /100 | #301 | Tragic 63.6% |
| Delaware | 0.0 /100 | #302 | Tragic 63.6% |
| Cree | 0.0 /100 | #303 | Tragic 63.5% |
| Immigrants | Nonimmigrants | 0.0 /100 | #304 | Tragic 63.5% |
| Osage | 0.0 /100 | #305 | Tragic 63.5% |
| Blacks/African Americans | 0.0 /100 | #306 | Tragic 63.4% |
| Central American Indians | 0.0 /100 | #307 | Tragic 63.4% |
Demographics Similar to Natives/Alaskans by In Labor Force | Age > 16
In terms of in labor force | age > 16, the demographic groups most similar to Natives/Alaskans are Menominee (60.6%, a difference of 0.020%), Apache (60.7%, a difference of 0.19%), Paiute (60.7%, a difference of 0.23%), Crow (60.8%, a difference of 0.31%), and Ute (60.9%, a difference of 0.49%).
| Demographics | Rating | Rank | In Labor Force | Age > 16 |
| Dutch West Indians | 0.0 /100 | #328 | Tragic 61.7% |
| Choctaw | 0.0 /100 | #329 | Tragic 61.5% |
| Creek | 0.0 /100 | #330 | Tragic 61.3% |
| Ute | 0.0 /100 | #331 | Tragic 60.9% |
| Crow | 0.0 /100 | #332 | Tragic 60.8% |
| Paiute | 0.0 /100 | #333 | Tragic 60.7% |
| Apache | 0.0 /100 | #334 | Tragic 60.7% |
| Natives/Alaskans | 0.0 /100 | #335 | Tragic 60.6% |
| Menominee | 0.0 /100 | #336 | Tragic 60.6% |
| Colville | 0.0 /100 | #337 | Tragic 59.8% |
| Immigrants | Yemen | 0.0 /100 | #338 | Tragic 59.6% |
| Houma | 0.0 /100 | #339 | Tragic 59.5% |
| Pueblo | 0.0 /100 | #340 | Tragic 59.3% |
| Hopi | 0.0 /100 | #341 | Tragic 58.4% |
| Puerto Ricans | 0.0 /100 | #342 | Tragic 58.1% |