Belizean vs Immigrants from Lithuania In Labor Force | Age 25-29
COMPARE
Belizean
Immigrants from Lithuania
In Labor Force | Age 25-29
In Labor Force | Age 25-29 Comparison
Belizeans
Immigrants from Lithuania
83.1%
IN LABOR FORCE | AGE 25-29
0.0/ 100
METRIC RATING
285th/ 347
METRIC RANK
86.1%
IN LABOR FORCE | AGE 25-29
100.0/ 100
METRIC RATING
12th/ 347
METRIC RANK
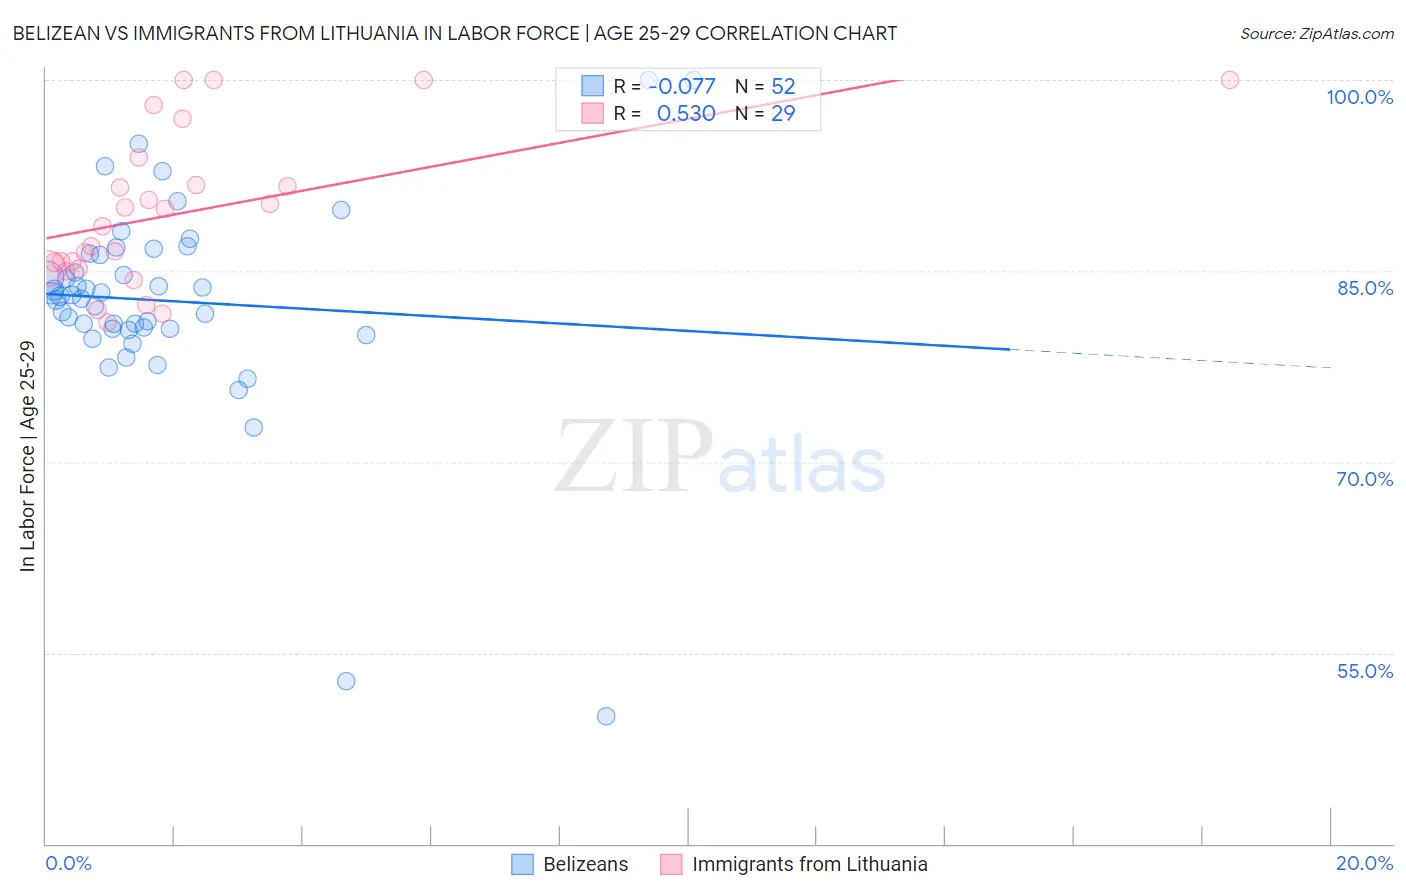
Belizean vs Immigrants from Lithuania In Labor Force | Age 25-29 Correlation Chart
The statistical analysis conducted on geographies consisting of 144,200,012 people shows a slight negative correlation between the proportion of Belizeans and labor force participation rate among population between the ages 25 and 29 in the United States with a correlation coefficient (R) of -0.077 and weighted average of 83.1%. Similarly, the statistical analysis conducted on geographies consisting of 117,715,877 people shows a substantial positive correlation between the proportion of Immigrants from Lithuania and labor force participation rate among population between the ages 25 and 29 in the United States with a correlation coefficient (R) of 0.530 and weighted average of 86.1%, a difference of 3.7%.
In Labor Force | Age 25-29 Correlation Summary
| Measurement | Belizean | Immigrants from Lithuania |
| Minimum | 50.0% | 81.0% |
| Maximum | 100.0% | 100.0% |
| Range | 50.0% | 19.0% |
| Mean | 82.6% | 89.5% |
| Median | 83.1% | 88.5% |
| Interquartile 25% (IQ1) | 80.5% | 85.2% |
| Interquartile 75% (IQ3) | 86.3% | 92.8% |
| Interquartile Range (IQR) | 5.8% | 7.6% |
| Standard Deviation (Sample) | 8.3% | 6.0% |
| Standard Deviation (Population) | 8.2% | 5.9% |
Similar Demographics by In Labor Force | Age 25-29
Demographics Similar to Belizeans by In Labor Force | Age 25-29
In terms of in labor force | age 25-29, the demographic groups most similar to Belizeans are Mexican American Indian (83.0%, a difference of 0.020%), Nicaraguan (83.1%, a difference of 0.030%), Guyanese (83.0%, a difference of 0.030%), American (83.1%, a difference of 0.060%), and Immigrants from the Azores (83.1%, a difference of 0.060%).
| Demographics | Rating | Rank | In Labor Force | Age 25-29 |
| Immigrants | Cuba | 0.0 /100 | #278 | Tragic 83.2% |
| British West Indians | 0.0 /100 | #279 | Tragic 83.2% |
| Dominicans | 0.0 /100 | #280 | Tragic 83.2% |
| Immigrants | Dominican Republic | 0.0 /100 | #281 | Tragic 83.1% |
| Americans | 0.0 /100 | #282 | Tragic 83.1% |
| Immigrants | Azores | 0.0 /100 | #283 | Tragic 83.1% |
| Nicaraguans | 0.0 /100 | #284 | Tragic 83.1% |
| Belizeans | 0.0 /100 | #285 | Tragic 83.1% |
| Mexican American Indians | 0.0 /100 | #286 | Tragic 83.0% |
| Guyanese | 0.0 /100 | #287 | Tragic 83.0% |
| Ottawa | 0.0 /100 | #288 | Tragic 83.0% |
| Immigrants | Micronesia | 0.0 /100 | #289 | Tragic 83.0% |
| Immigrants | Bangladesh | 0.0 /100 | #290 | Tragic 83.0% |
| Hawaiians | 0.0 /100 | #291 | Tragic 83.0% |
| Immigrants | Guyana | 0.0 /100 | #292 | Tragic 83.0% |
Demographics Similar to Immigrants from Lithuania by In Labor Force | Age 25-29
In terms of in labor force | age 25-29, the demographic groups most similar to Immigrants from Lithuania are Liberian (86.1%, a difference of 0.010%), Immigrants from Ethiopia (86.1%, a difference of 0.010%), Norwegian (86.1%, a difference of 0.010%), Latvian (86.1%, a difference of 0.040%), and Bolivian (86.1%, a difference of 0.040%).
| Demographics | Rating | Rank | In Labor Force | Age 25-29 |
| Luxembourgers | 100.0 /100 | #5 | Exceptional 86.9% |
| Slovenes | 100.0 /100 | #6 | Exceptional 86.4% |
| Immigrants | Bosnia and Herzegovina | 100.0 /100 | #7 | Exceptional 86.3% |
| Immigrants | Cabo Verde | 100.0 /100 | #8 | Exceptional 86.2% |
| Ethiopians | 100.0 /100 | #9 | Exceptional 86.2% |
| Liberians | 100.0 /100 | #10 | Exceptional 86.1% |
| Immigrants | Ethiopia | 100.0 /100 | #11 | Exceptional 86.1% |
| Immigrants | Lithuania | 100.0 /100 | #12 | Exceptional 86.1% |
| Norwegians | 100.0 /100 | #13 | Exceptional 86.1% |
| Latvians | 100.0 /100 | #14 | Exceptional 86.1% |
| Bolivians | 100.0 /100 | #15 | Exceptional 86.1% |
| Immigrants | Bolivia | 100.0 /100 | #16 | Exceptional 86.1% |
| Bermudans | 100.0 /100 | #17 | Exceptional 86.0% |
| Bulgarians | 100.0 /100 | #18 | Exceptional 86.0% |
| Cape Verdeans | 100.0 /100 | #19 | Exceptional 86.0% |