Polish vs Navajo In Labor Force | Age 25-29
COMPARE
Polish
Navajo
In Labor Force | Age 25-29
In Labor Force | Age 25-29 Comparison
Poles
Navajo
85.8%
IN LABOR FORCE | AGE 25-29
99.9/ 100
METRIC RATING
37th/ 347
METRIC RANK
74.6%
IN LABOR FORCE | AGE 25-29
0.0/ 100
METRIC RATING
345th/ 347
METRIC RANK
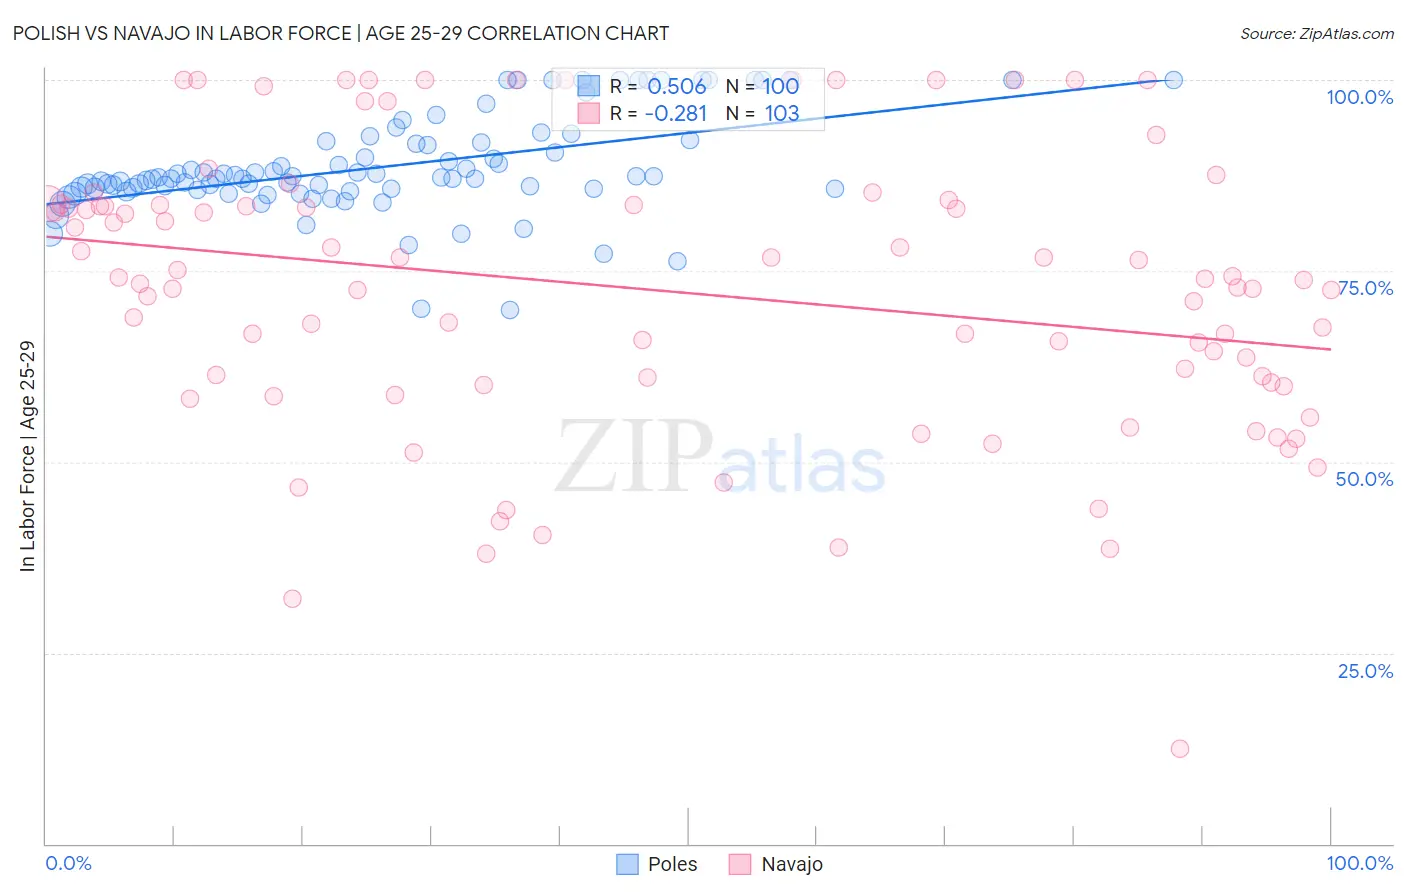
Polish vs Navajo In Labor Force | Age 25-29 Correlation Chart
The statistical analysis conducted on geographies consisting of 559,462,142 people shows a substantial positive correlation between the proportion of Poles and labor force participation rate among population between the ages 25 and 29 in the United States with a correlation coefficient (R) of 0.506 and weighted average of 85.8%. Similarly, the statistical analysis conducted on geographies consisting of 224,779,280 people shows a weak negative correlation between the proportion of Navajo and labor force participation rate among population between the ages 25 and 29 in the United States with a correlation coefficient (R) of -0.281 and weighted average of 74.6%, a difference of 14.9%.
In Labor Force | Age 25-29 Correlation Summary
| Measurement | Polish | Navajo |
| Minimum | 69.9% | 12.5% |
| Maximum | 100.0% | 100.0% |
| Range | 30.1% | 87.5% |
| Mean | 88.7% | 72.4% |
| Median | 87.2% | 73.9% |
| Interquartile 25% (IQ1) | 85.7% | 60.0% |
| Interquartile 75% (IQ3) | 91.9% | 83.7% |
| Interquartile Range (IQR) | 6.2% | 23.7% |
| Standard Deviation (Sample) | 6.4% | 18.5% |
| Standard Deviation (Population) | 6.4% | 18.4% |
Similar Demographics by In Labor Force | Age 25-29
Demographics Similar to Poles by In Labor Force | Age 25-29
In terms of in labor force | age 25-29, the demographic groups most similar to Poles are Sierra Leonean (85.8%, a difference of 0.020%), Cypriot (85.8%, a difference of 0.030%), Immigrants from Nepal (85.8%, a difference of 0.030%), Croatian (85.8%, a difference of 0.030%), and Lithuanian (85.8%, a difference of 0.040%).
| Demographics | Rating | Rank | In Labor Force | Age 25-29 |
| Immigrants | Serbia | 100.0 /100 | #30 | Exceptional 85.9% |
| German Russians | 100.0 /100 | #31 | Exceptional 85.8% |
| Slovaks | 100.0 /100 | #32 | Exceptional 85.8% |
| Immigrants | Bulgaria | 100.0 /100 | #33 | Exceptional 85.8% |
| Lithuanians | 99.9 /100 | #34 | Exceptional 85.8% |
| Cypriots | 99.9 /100 | #35 | Exceptional 85.8% |
| Immigrants | Nepal | 99.9 /100 | #36 | Exceptional 85.8% |
| Poles | 99.9 /100 | #37 | Exceptional 85.8% |
| Sierra Leoneans | 99.9 /100 | #38 | Exceptional 85.8% |
| Croatians | 99.9 /100 | #39 | Exceptional 85.8% |
| Immigrants | Albania | 99.9 /100 | #40 | Exceptional 85.7% |
| Immigrants | Greece | 99.9 /100 | #41 | Exceptional 85.7% |
| Immigrants | Eritrea | 99.9 /100 | #42 | Exceptional 85.7% |
| Immigrants | India | 99.9 /100 | #43 | Exceptional 85.7% |
| Macedonians | 99.9 /100 | #44 | Exceptional 85.7% |
Demographics Similar to Navajo by In Labor Force | Age 25-29
In terms of in labor force | age 25-29, the demographic groups most similar to Navajo are Pima (74.3%, a difference of 0.48%), Yup'ik (73.1%, a difference of 2.2%), Hopi (76.5%, a difference of 2.5%), Arapaho (76.6%, a difference of 2.6%), and Pueblo (77.5%, a difference of 3.8%).
| Demographics | Rating | Rank | In Labor Force | Age 25-29 |
| Sioux | 0.0 /100 | #333 | Tragic 79.7% |
| Yuman | 0.0 /100 | #334 | Tragic 79.3% |
| Natives/Alaskans | 0.0 /100 | #335 | Tragic 79.3% |
| Apache | 0.0 /100 | #336 | Tragic 79.2% |
| Crow | 0.0 /100 | #337 | Tragic 78.6% |
| Lumbee | 0.0 /100 | #338 | Tragic 78.3% |
| Immigrants | Yemen | 0.0 /100 | #339 | Tragic 78.2% |
| Paiute | 0.0 /100 | #340 | Tragic 78.1% |
| Tohono O'odham | 0.0 /100 | #341 | Tragic 77.5% |
| Pueblo | 0.0 /100 | #342 | Tragic 77.5% |
| Arapaho | 0.0 /100 | #343 | Tragic 76.6% |
| Hopi | 0.0 /100 | #344 | Tragic 76.5% |
| Navajo | 0.0 /100 | #345 | Tragic 74.6% |
| Pima | 0.0 /100 | #346 | Tragic 74.3% |
| Yup'ik | 0.0 /100 | #347 | Tragic 73.1% |