Polish vs Immigrants from North America In Labor Force | Age 25-29
COMPARE
Polish
Immigrants from North America
In Labor Force | Age 25-29
In Labor Force | Age 25-29 Comparison
Poles
Immigrants from North America
85.8%
IN LABOR FORCE | AGE 25-29
99.9/ 100
METRIC RATING
37th/ 347
METRIC RANK
84.8%
IN LABOR FORCE | AGE 25-29
72.1/ 100
METRIC RATING
140th/ 347
METRIC RANK
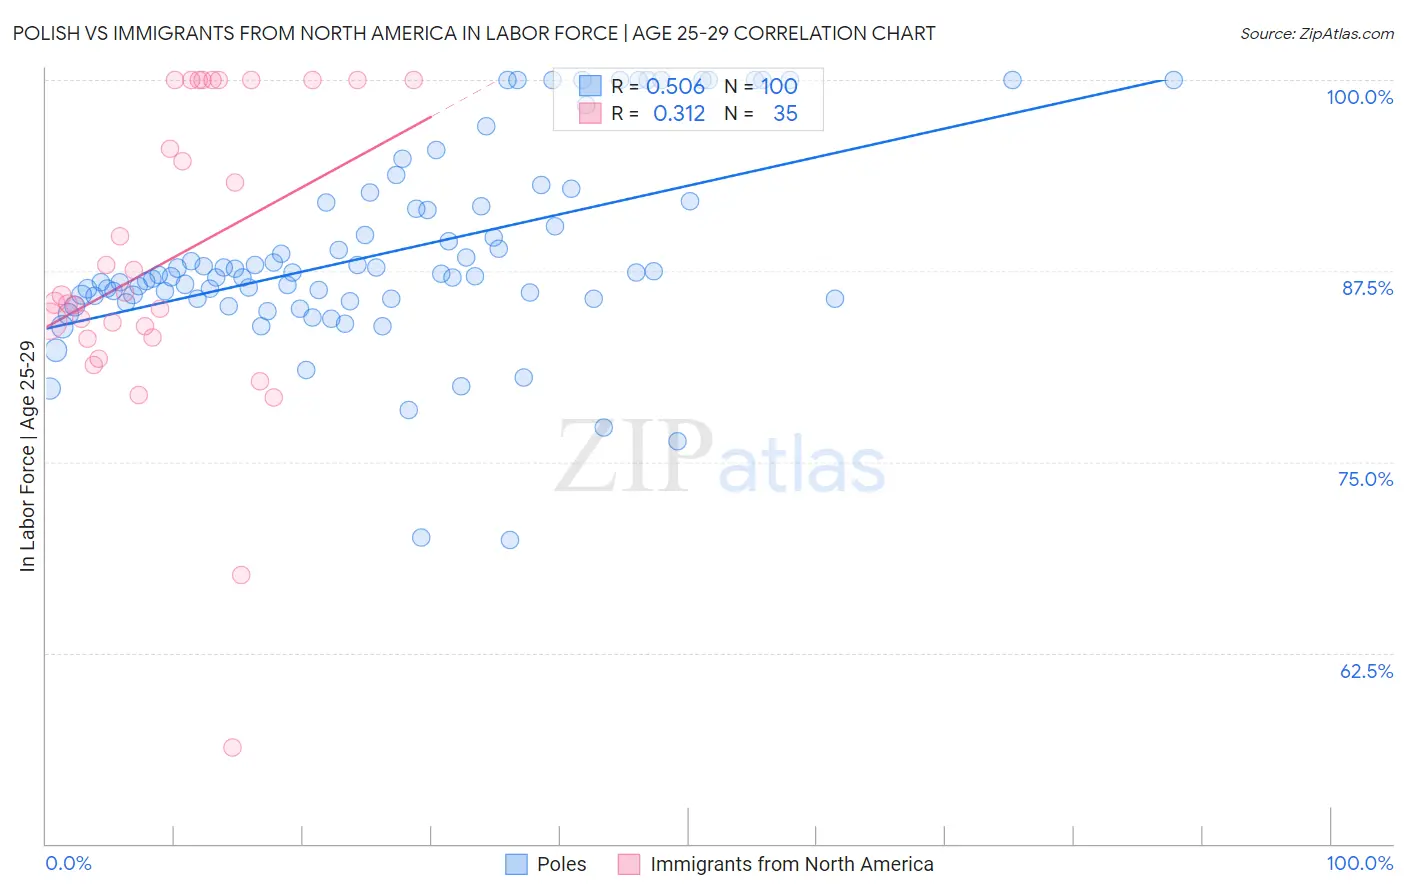
Polish vs Immigrants from North America In Labor Force | Age 25-29 Correlation Chart
The statistical analysis conducted on geographies consisting of 559,462,142 people shows a substantial positive correlation between the proportion of Poles and labor force participation rate among population between the ages 25 and 29 in the United States with a correlation coefficient (R) of 0.506 and weighted average of 85.8%. Similarly, the statistical analysis conducted on geographies consisting of 462,119,191 people shows a mild positive correlation between the proportion of Immigrants from North America and labor force participation rate among population between the ages 25 and 29 in the United States with a correlation coefficient (R) of 0.312 and weighted average of 84.8%, a difference of 1.1%.
In Labor Force | Age 25-29 Correlation Summary
| Measurement | Polish | Immigrants from North America |
| Minimum | 69.9% | 56.3% |
| Maximum | 100.0% | 100.0% |
| Range | 30.1% | 43.7% |
| Mean | 88.7% | 88.3% |
| Median | 87.2% | 85.9% |
| Interquartile 25% (IQ1) | 85.7% | 83.2% |
| Interquartile 75% (IQ3) | 91.9% | 100.0% |
| Interquartile Range (IQR) | 6.2% | 16.8% |
| Standard Deviation (Sample) | 6.4% | 10.0% |
| Standard Deviation (Population) | 6.4% | 9.9% |
Similar Demographics by In Labor Force | Age 25-29
Demographics Similar to Poles by In Labor Force | Age 25-29
In terms of in labor force | age 25-29, the demographic groups most similar to Poles are Sierra Leonean (85.8%, a difference of 0.020%), Cypriot (85.8%, a difference of 0.030%), Immigrants from Nepal (85.8%, a difference of 0.030%), Croatian (85.8%, a difference of 0.030%), and Lithuanian (85.8%, a difference of 0.040%).
| Demographics | Rating | Rank | In Labor Force | Age 25-29 |
| Immigrants | Serbia | 100.0 /100 | #30 | Exceptional 85.9% |
| German Russians | 100.0 /100 | #31 | Exceptional 85.8% |
| Slovaks | 100.0 /100 | #32 | Exceptional 85.8% |
| Immigrants | Bulgaria | 100.0 /100 | #33 | Exceptional 85.8% |
| Lithuanians | 99.9 /100 | #34 | Exceptional 85.8% |
| Cypriots | 99.9 /100 | #35 | Exceptional 85.8% |
| Immigrants | Nepal | 99.9 /100 | #36 | Exceptional 85.8% |
| Poles | 99.9 /100 | #37 | Exceptional 85.8% |
| Sierra Leoneans | 99.9 /100 | #38 | Exceptional 85.8% |
| Croatians | 99.9 /100 | #39 | Exceptional 85.8% |
| Immigrants | Albania | 99.9 /100 | #40 | Exceptional 85.7% |
| Immigrants | Greece | 99.9 /100 | #41 | Exceptional 85.7% |
| Immigrants | Eritrea | 99.9 /100 | #42 | Exceptional 85.7% |
| Immigrants | India | 99.9 /100 | #43 | Exceptional 85.7% |
| Macedonians | 99.9 /100 | #44 | Exceptional 85.7% |
Demographics Similar to Immigrants from North America by In Labor Force | Age 25-29
In terms of in labor force | age 25-29, the demographic groups most similar to Immigrants from North America are Immigrants from Eastern Asia (84.8%, a difference of 0.0%), Danish (84.8%, a difference of 0.0%), Immigrants from Canada (84.8%, a difference of 0.010%), Armenian (84.8%, a difference of 0.010%), and Pakistani (84.8%, a difference of 0.020%).
| Demographics | Rating | Rank | In Labor Force | Age 25-29 |
| Asians | 77.7 /100 | #133 | Good 84.8% |
| Syrians | 76.5 /100 | #134 | Good 84.8% |
| Immigrants | Hungary | 76.4 /100 | #135 | Good 84.8% |
| Bhutanese | 76.0 /100 | #136 | Good 84.8% |
| Immigrants | Canada | 73.5 /100 | #137 | Good 84.8% |
| Armenians | 72.7 /100 | #138 | Good 84.8% |
| Immigrants | Eastern Asia | 72.6 /100 | #139 | Good 84.8% |
| Immigrants | North America | 72.1 /100 | #140 | Good 84.8% |
| Danes | 71.9 /100 | #141 | Good 84.8% |
| Pakistanis | 70.0 /100 | #142 | Good 84.8% |
| Sri Lankans | 69.2 /100 | #143 | Good 84.8% |
| Immigrants | Laos | 69.0 /100 | #144 | Good 84.8% |
| Immigrants | Senegal | 68.3 /100 | #145 | Good 84.8% |
| Icelanders | 68.2 /100 | #146 | Good 84.8% |
| Immigrants | Asia | 68.2 /100 | #147 | Good 84.8% |