European vs Immigrants from Lithuania In Labor Force | Age 25-29

COMPARE

European
Race
Ancestry
AfghanAfricanAlaska NativeAlaskan AthabascanAlbanianAleutAlsatianAmericanApacheArabArapahoArgentineanArmenianAssyrian/Chaldean/SyriacAustralianAustrianBahamianBangladeshiBarbadianBasqueBelgianBelizeanBermudanBhutaneseBlackfeetBolivianBrazilianBritishBritish West IndianBulgarianBurmeseCajunCambodianCanadianCape VerdeanCarpatho RusynCelticCentral AmericanCentral American IndianCherokeeCheyenneChickasawChileanChineseChippewaChoctawColombianColvilleComancheCosta RicanCreeCreekCroatianCrowCubanCypriotCzechCzechoslovakianDanishDelawareDominicanDutchDutch West IndianEastern EuropeanEcuadorianEgyptianEnglishEstonianEthiopianEuropeanFijianFilipinoFinnishFrenchFrench American IndianFrench CanadianGermanGerman RussianGhanaianGreekGuamanian/ChamorroGuatemalanGuyaneseHaitianHmongHonduranHopiHoumaHungarianIcelanderIndian (Asian)IndonesianInupiatIranianIraqiIrishIroquoisIsraeliItalianJamaicanJapaneseJordanianKenyanKiowaKoreanLaotianLatvianLebaneseLiberianLithuanianLumbeeLuxembourgerMacedonianMalaysianMalteseMarshalleseMenomineeMexicanMexican American IndianMongolianMoroccanNative HawaiianNavajoNepaleseNew ZealanderNicaraguanNigerianNorthern EuropeanNorwegianOkinawanOsageOttawaPaiutePakistaniPalestinianPanamanianParaguayanPennsylvania GermanPeruvianPimaPolishPortuguesePotawatomiPuebloPuerto RicanPuget Sound SalishRomanianRussianSalvadoranSamoanScandinavianScotch-IrishScottishSeminoleSenegaleseSerbianShoshoneSierra LeoneanSiouxSlavicSlovakSloveneSomaliSouth AfricanSouth AmericanSouth American IndianSoviet UnionSpaniardSpanishSpanish AmericanSpanish American IndianSri LankanSubsaharan AfricanSudaneseSwedishSwissSyrianTaiwaneseThaiTlingit-HaidaTohono O'OdhamTonganTrinidadian and TobagonianTsimshianTurkishU.S. Virgin IslanderUgandanUkrainianUruguayanUteVenezuelanVietnameseWelshWest IndianYakamaYaquiYugoslavianYumanYup'ikZimbabwean
Immigration
NonimmigrantsImmigrantsAfghanistanAfricaAlbaniaArgentinaArmeniaAsiaAustraliaAustriaBahamasBangladeshBarbadosBelarusBelgiumBelizeBoliviaBosnia and HerzegovinaBrazilBulgariaBurma/MyanmarCabo VerdeCambodiaCameroonCanadaCaribbeanCentral AmericaChileChinaColombiaCongoCosta RicaCroatiaCubaCzechoslovakiaDenmarkDominicaDominican RepublicEastern AfricaEastern AsiaEastern EuropeEcuadorEgyptEl SalvadorEnglandEritreaEthiopiaEuropeFijiFranceGermanyGhanaGreeceGrenadaGuatemalaGuyanaHaitiHondurasHong KongHungaryIndiaIndonesiaIranIraqIrelandIsraelItalyJamaicaJapanJordanKazakhstanKenyaKoreaKuwaitLaosLatin AmericaLatviaLebanonLiberiaMalaysiaMexicoMicronesiaMiddle AfricaMoldovaMoroccoNepalNetherlandsNicaraguaNigeriaNorth AmericaNorth MacedoniaNorthern AfricaNorthern EuropeNorwayOceaniaPakistanPanamaPeruPhilippinesPolandPortugalRomaniaRussiaSaudi ArabiaScotlandSenegalSerbiaSierra LeoneSingaporeSomaliaSouth AfricaSouth AmericaSouth Central AsiaSouth Eastern AsiaSouthern EuropeSpainSri LankaSt. Vincent and the GrenadinesSudanSwedenSwitzerlandSyriaTaiwanThailandTrinidad and TobagoTurkeyUgandaUkraineUruguayUzbekistanVenezuelaVietnamWest IndiesWestern AfricaWestern AsiaWestern EuropeYemenZaireZimbabweAzores
Immigrants from Lithuania
Race
Ancestry
AfghanAfricanAlaska NativeAlaskan AthabascanAlbanianAleutAlsatianAmericanApacheArabArapahoArgentineanArmenianAssyrian/Chaldean/SyriacAustralianAustrianBahamianBangladeshiBarbadianBasqueBelgianBelizeanBermudanBhutaneseBlackfeetBolivianBrazilianBritishBritish West IndianBulgarianBurmeseCajunCambodianCanadianCape VerdeanCarpatho RusynCelticCentral AmericanCentral American IndianCherokeeCheyenneChickasawChileanChineseChippewaChoctawColombianColvilleComancheCosta RicanCreeCreekCroatianCrowCubanCypriotCzechCzechoslovakianDanishDelawareDominicanDutchDutch West IndianEastern EuropeanEcuadorianEgyptianEnglishEstonianEthiopianFijianFilipinoFinnishFrenchFrench American IndianFrench CanadianGermanGerman RussianGhanaianGreekGuamanian/ChamorroGuatemalanGuyaneseHaitianHmongHonduranHopiHoumaHungarianIcelanderIndian (Asian)IndonesianInupiatIranianIraqiIrishIroquoisIsraeliItalianJamaicanJapaneseJordanianKenyanKiowaKoreanLaotianLatvianLebaneseLiberianLithuanianLumbeeLuxembourgerMacedonianMalaysianMalteseMarshalleseMenomineeMexicanMexican American IndianMongolianMoroccanNative HawaiianNavajoNepaleseNew ZealanderNicaraguanNigerianNorthern EuropeanNorwegianOkinawanOsageOttawaPaiutePakistaniPalestinianPanamanianParaguayanPennsylvania GermanPeruvianPimaPolishPortuguesePotawatomiPuebloPuerto RicanPuget Sound SalishRomanianRussianSalvadoranSamoanScandinavianScotch-IrishScottishSeminoleSenegaleseSerbianShoshoneSierra LeoneanSiouxSlavicSlovakSloveneSomaliSouth AfricanSouth AmericanSouth American IndianSoviet UnionSpaniardSpanishSpanish AmericanSpanish American IndianSri LankanSubsaharan AfricanSudaneseSwedishSwissSyrianTaiwaneseThaiTlingit-HaidaTohono O'OdhamTonganTrinidadian and TobagonianTsimshianTurkishU.S. Virgin IslanderUgandanUkrainianUruguayanUteVenezuelanVietnameseWelshWest IndianYakamaYaquiYugoslavianYumanYup'ikZimbabwean
Immigration
NonimmigrantsImmigrantsAfghanistanAfricaAlbaniaArgentinaArmeniaAsiaAustraliaAustriaBahamasBangladeshBarbadosBelarusBelgiumBelizeBoliviaBosnia and HerzegovinaBrazilBulgariaBurma/MyanmarCabo VerdeCambodiaCameroonCanadaCaribbeanCentral AmericaChileChinaColombiaCongoCosta RicaCroatiaCubaCzechoslovakiaDenmarkDominicaDominican RepublicEastern AfricaEastern AsiaEastern EuropeEcuadorEgyptEl SalvadorEnglandEritreaEthiopiaEuropeFijiFranceGermanyGhanaGreeceGrenadaGuatemalaGuyanaHaitiHondurasHong KongHungaryIndiaIndonesiaIranIraqIrelandIsraelItalyJamaicaJapanJordanKazakhstanKenyaKoreaKuwaitLaosLatin AmericaLatviaLebanonLiberiaLithuaniaMalaysiaMexicoMicronesiaMiddle AfricaMoldovaMoroccoNepalNetherlandsNicaraguaNigeriaNorth AmericaNorth MacedoniaNorthern AfricaNorthern EuropeNorwayOceaniaPakistanPanamaPeruPhilippinesPolandPortugalRomaniaRussiaSaudi ArabiaScotlandSenegalSerbiaSierra LeoneSingaporeSomaliaSouth AfricaSouth AmericaSouth Central AsiaSouth Eastern AsiaSouthern EuropeSpainSri LankaSt. Vincent and the GrenadinesSudanSwedenSwitzerlandSyriaTaiwanThailandTrinidad and TobagoTurkeyUgandaUkraineUruguayUzbekistanVenezuelaVietnamWest IndiesWestern AfricaWestern AsiaWestern EuropeYemenZaireZimbabweAzores
In Labor Force | Age 25-29
Income
Poverty
Unemployment
Labor Participation
Family Structure
Vehicle Availability
Education Level
Disability

In Labor Force | Age 25-29 Comparison

Europeans

Immigrants from Lithuania

Average
Exceptional
84.6%
IN LABOR FORCE | AGE 25-29
40.3/ 100
METRIC RATING
182nd/ 347
METRIC RANK
86.1%
IN LABOR FORCE | AGE 25-29
100.0/ 100
METRIC RATING
12th/ 347
METRIC RANK

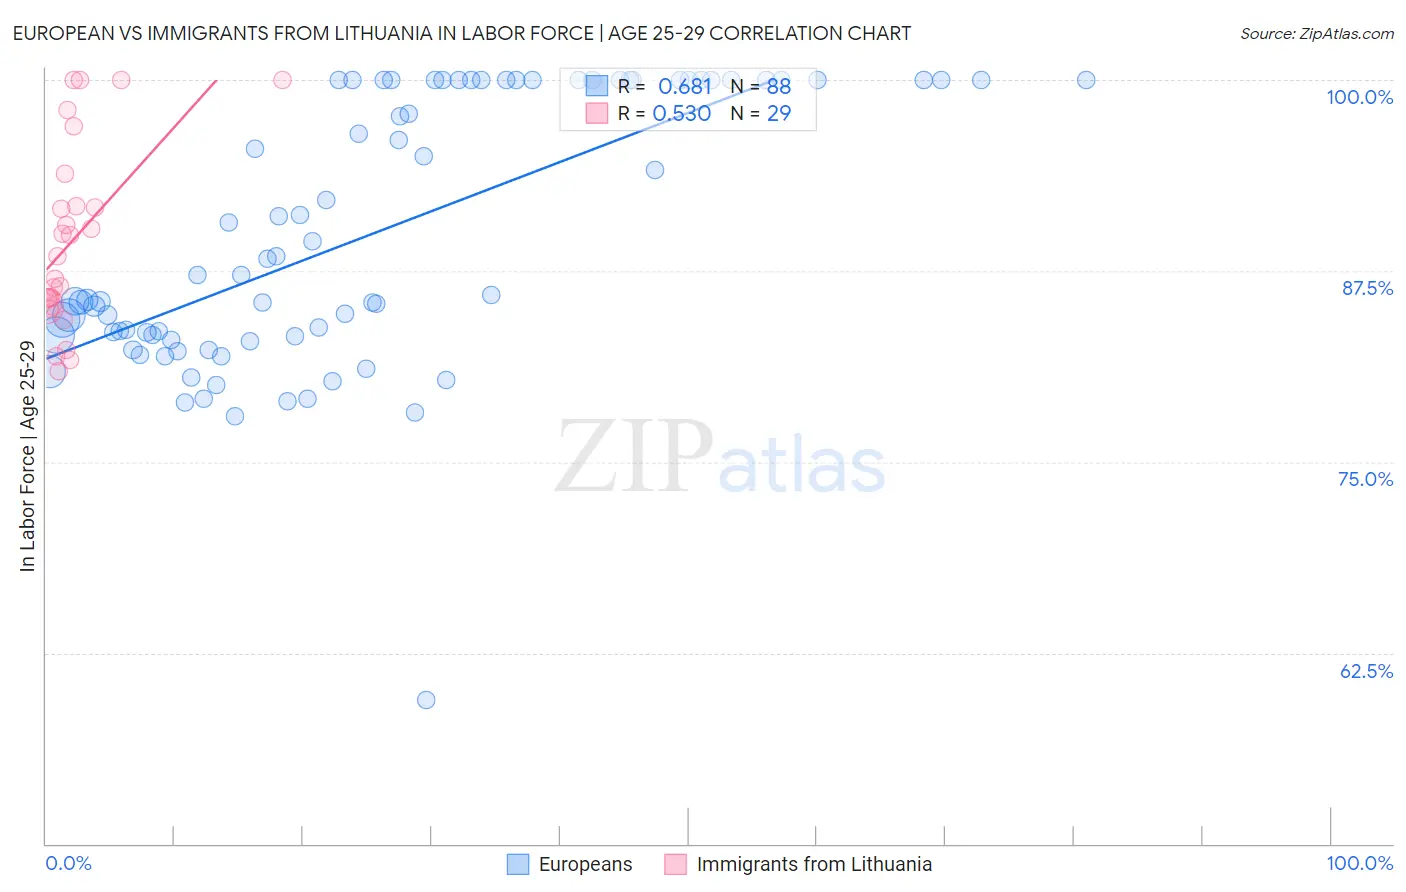
European vs Immigrants from Lithuania In Labor Force | Age 25-29 Correlation Chart

The statistical analysis conducted on geographies consisting of 560,805,282 people shows a significant positive correlation between the proportion of Europeans and labor force participation rate among population between the ages 25 and 29 in the United States with a correlation coefficient (R) of 0.681 and weighted average of 84.6%. Similarly, the statistical analysis conducted on geographies consisting of 117,715,877 people shows a substantial positive correlation between the proportion of Immigrants from Lithuania and labor force participation rate among population between the ages 25 and 29 in the United States with a correlation coefficient (R) of 0.530 and weighted average of 86.1%, a difference of 1.8%.
European vs Immigrants from Lithuania In Labor Force | Age 25-29

In Labor Force | Age 25-29 Correlation Summary

MeasurementEuropeanImmigrants from Lithuania
Minimum59.4%81.0%
Maximum100.0%100.0%
Range40.6%19.0%
Mean89.9%89.5%
Median87.3%88.5%
Interquartile 25% (IQ1)83.3%85.2%
Interquartile 75% (IQ3)100.0%92.8%
Interquartile Range (IQR)16.7%7.6%
Standard Deviation (Sample)8.7%6.0%
Standard Deviation (Population)8.7%5.9%

Similar Demographics by In Labor Force | Age 25-29

Demographics Similar to Europeans by In Labor Force | Age 25-29

In terms of in labor force | age 25-29, the demographic groups most similar to Europeans are Scottish (84.6%, a difference of 0.0%), Immigrants from Norway (84.6%, a difference of 0.010%), Immigrants from South America (84.6%, a difference of 0.020%), Immigrants from Kuwait (84.6%, a difference of 0.020%), and Immigrants from Argentina (84.6%, a difference of 0.030%).
DemographicsRating | RankIn Labor Force | Age 25-29
Hungarians
47.8
/100
|
#175
Average
84.6%
Malaysians
46.8
/100
|
#176
Average
84.6%
Immigrants | China
45.7
/100
|
#177
Average
84.6%
Immigrants | Thailand
45.2
/100
|
#178
Average
84.6%
Immigrants | Argentina
44.0
/100
|
#179
Average
84.6%
Immigrants | South America
42.9
/100
|
#180
Average
84.6%
Immigrants | Norway
41.9
/100
|
#181
Average
84.6%
Europeans
40.3
/100
|
#182
Average
84.6%
Scottish
40.1
/100
|
#183
Average
84.6%
Immigrants | Kuwait
38.2
/100
|
#184
Fair
84.6%
Immigrants | Denmark
37.0
/100
|
#185
Fair
84.6%
Immigrants | Belgium
35.0
/100
|
#186
Fair
84.6%
Immigrants | Portugal
34.7
/100
|
#187
Fair
84.6%
Immigrants | Ukraine
33.7
/100
|
#188
Fair
84.5%
Moroccans
32.6
/100
|
#189
Fair
84.5%

Demographics Similar to Immigrants from Lithuania by In Labor Force | Age 25-29

In terms of in labor force | age 25-29, the demographic groups most similar to Immigrants from Lithuania are Liberian (86.1%, a difference of 0.010%), Immigrants from Ethiopia (86.1%, a difference of 0.010%), Norwegian (86.1%, a difference of 0.010%), Latvian (86.1%, a difference of 0.040%), and Bolivian (86.1%, a difference of 0.040%).
DemographicsRating | RankIn Labor Force | Age 25-29
Luxembourgers
100.0
/100
|
#5
Exceptional
86.9%
Slovenes
100.0
/100
|
#6
Exceptional
86.4%
Immigrants | Bosnia and Herzegovina
100.0
/100
|
#7
Exceptional
86.3%
Immigrants | Cabo Verde
100.0
/100
|
#8
Exceptional
86.2%
Ethiopians
100.0
/100
|
#9
Exceptional
86.2%
Liberians
100.0
/100
|
#10
Exceptional
86.1%
Immigrants | Ethiopia
100.0
/100
|
#11
Exceptional
86.1%
Immigrants | Lithuania
100.0
/100
|
#12
Exceptional
86.1%
Norwegians
100.0
/100
|
#13
Exceptional
86.1%
Latvians
100.0
/100
|
#14
Exceptional
86.1%
Bolivians
100.0
/100
|
#15
Exceptional
86.1%
Immigrants | Bolivia
100.0
/100
|
#16
Exceptional
86.1%
Bermudans
100.0
/100
|
#17
Exceptional
86.0%
Bulgarians
100.0
/100
|
#18
Exceptional
86.0%
Cape Verdeans
100.0
/100
|
#19
Exceptional
86.0%