Pima vs Hispanic or Latino In Labor Force | Age 25-29
COMPARE
Pima
Hispanic or Latino
In Labor Force | Age 25-29
In Labor Force | Age 25-29 Comparison
Pima
Hispanics or Latinos
74.3%
IN LABOR FORCE | AGE 25-29
0.0/ 100
METRIC RATING
346th/ 347
METRIC RANK
82.2%
IN LABOR FORCE | AGE 25-29
0.0/ 100
METRIC RATING
312th/ 347
METRIC RANK
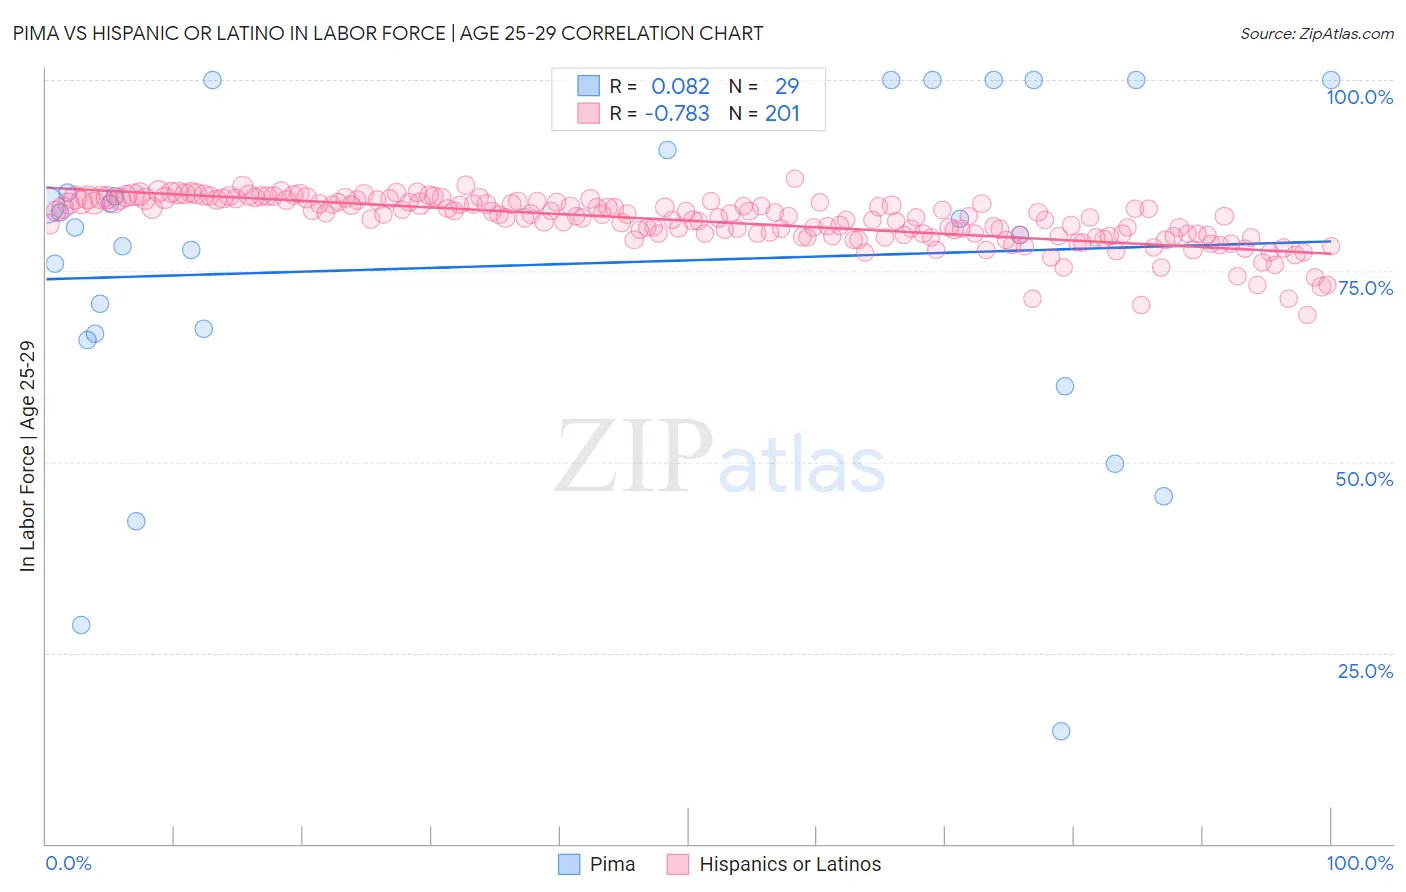
Pima vs Hispanic or Latino In Labor Force | Age 25-29 Correlation Chart
The statistical analysis conducted on geographies consisting of 61,533,053 people shows a slight positive correlation between the proportion of Pima and labor force participation rate among population between the ages 25 and 29 in the United States with a correlation coefficient (R) of 0.082 and weighted average of 74.3%. Similarly, the statistical analysis conducted on geographies consisting of 577,042,190 people shows a strong negative correlation between the proportion of Hispanics or Latinos and labor force participation rate among population between the ages 25 and 29 in the United States with a correlation coefficient (R) of -0.783 and weighted average of 82.2%, a difference of 10.7%.
In Labor Force | Age 25-29 Correlation Summary
| Measurement | Pima | Hispanic or Latino |
| Minimum | 14.8% | 69.3% |
| Maximum | 100.0% | 87.0% |
| Range | 85.2% | 17.7% |
| Mean | 75.8% | 81.6% |
| Median | 80.7% | 82.2% |
| Interquartile 25% (IQ1) | 66.3% | 79.7% |
| Interquartile 75% (IQ3) | 95.4% | 84.1% |
| Interquartile Range (IQR) | 29.1% | 4.4% |
| Standard Deviation (Sample) | 22.3% | 3.2% |
| Standard Deviation (Population) | 21.9% | 3.2% |
Similar Demographics by In Labor Force | Age 25-29
Demographics Similar to Pima by In Labor Force | Age 25-29
In terms of in labor force | age 25-29, the demographic groups most similar to Pima are Navajo (74.6%, a difference of 0.48%), Yup'ik (73.1%, a difference of 1.7%), Hopi (76.5%, a difference of 3.0%), Arapaho (76.6%, a difference of 3.1%), and Pueblo (77.5%, a difference of 4.3%).
| Demographics | Rating | Rank | In Labor Force | Age 25-29 |
| Sioux | 0.0 /100 | #333 | Tragic 79.7% |
| Yuman | 0.0 /100 | #334 | Tragic 79.3% |
| Natives/Alaskans | 0.0 /100 | #335 | Tragic 79.3% |
| Apache | 0.0 /100 | #336 | Tragic 79.2% |
| Crow | 0.0 /100 | #337 | Tragic 78.6% |
| Lumbee | 0.0 /100 | #338 | Tragic 78.3% |
| Immigrants | Yemen | 0.0 /100 | #339 | Tragic 78.2% |
| Paiute | 0.0 /100 | #340 | Tragic 78.1% |
| Tohono O'odham | 0.0 /100 | #341 | Tragic 77.5% |
| Pueblo | 0.0 /100 | #342 | Tragic 77.5% |
| Arapaho | 0.0 /100 | #343 | Tragic 76.6% |
| Hopi | 0.0 /100 | #344 | Tragic 76.5% |
| Navajo | 0.0 /100 | #345 | Tragic 74.6% |
| Pima | 0.0 /100 | #346 | Tragic 74.3% |
| Yup'ik | 0.0 /100 | #347 | Tragic 73.1% |
Demographics Similar to Hispanics or Latinos by In Labor Force | Age 25-29
In terms of in labor force | age 25-29, the demographic groups most similar to Hispanics or Latinos are Alaskan Athabascan (82.3%, a difference of 0.070%), Osage (82.3%, a difference of 0.080%), Yaqui (82.2%, a difference of 0.10%), Cherokee (82.1%, a difference of 0.14%), and Immigrants from Central America (82.4%, a difference of 0.21%).
| Demographics | Rating | Rank | In Labor Force | Age 25-29 |
| Blacks/African Americans | 0.0 /100 | #305 | Tragic 82.6% |
| Blackfeet | 0.0 /100 | #306 | Tragic 82.6% |
| Cajuns | 0.0 /100 | #307 | Tragic 82.5% |
| Central American Indians | 0.0 /100 | #308 | Tragic 82.4% |
| Immigrants | Central America | 0.0 /100 | #309 | Tragic 82.4% |
| Osage | 0.0 /100 | #310 | Tragic 82.3% |
| Alaskan Athabascans | 0.0 /100 | #311 | Tragic 82.3% |
| Hispanics or Latinos | 0.0 /100 | #312 | Tragic 82.2% |
| Yaqui | 0.0 /100 | #313 | Tragic 82.2% |
| Cherokee | 0.0 /100 | #314 | Tragic 82.1% |
| Immigrants | Mexico | 0.0 /100 | #315 | Tragic 82.0% |
| Mexicans | 0.0 /100 | #316 | Tragic 81.9% |
| Chickasaw | 0.0 /100 | #317 | Tragic 81.9% |
| Comanche | 0.0 /100 | #318 | Tragic 81.9% |
| Seminole | 0.0 /100 | #319 | Tragic 81.7% |