Immigrants from Zimbabwe vs Immigrants from Jamaica In Labor Force | Age 20-24
COMPARE
Immigrants from Zimbabwe
Immigrants from Jamaica
In Labor Force | Age 20-24
In Labor Force | Age 20-24 Comparison
Immigrants from Zimbabwe
Immigrants from Jamaica
75.9%
IN LABOR FORCE | AGE 20-24
95.1/ 100
METRIC RATING
114th/ 347
METRIC RANK
72.4%
IN LABOR FORCE | AGE 20-24
0.0/ 100
METRIC RATING
306th/ 347
METRIC RANK
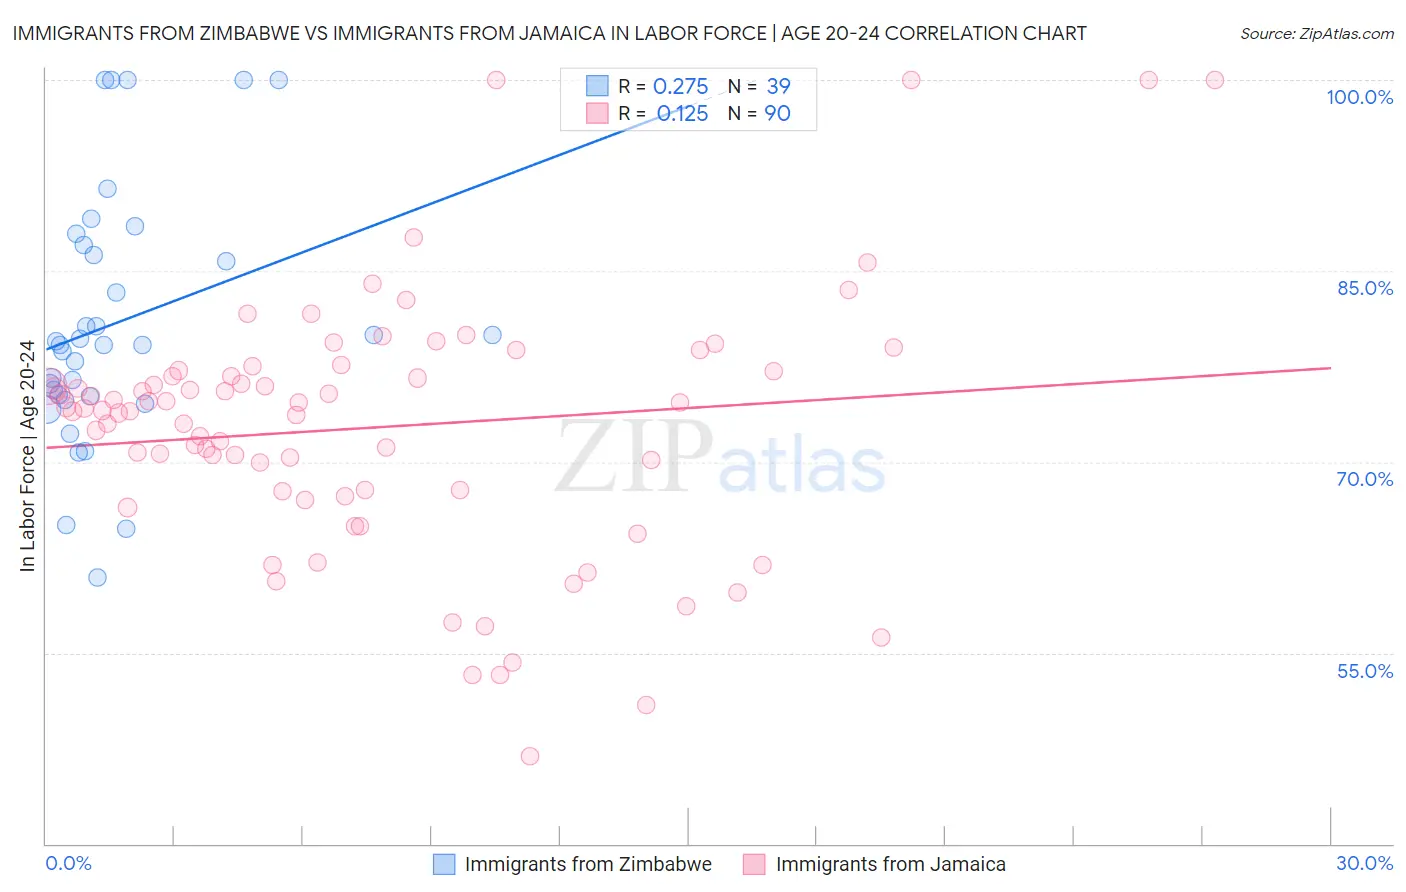
Immigrants from Zimbabwe vs Immigrants from Jamaica In Labor Force | Age 20-24 Correlation Chart
The statistical analysis conducted on geographies consisting of 117,807,327 people shows a weak positive correlation between the proportion of Immigrants from Zimbabwe and labor force participation rate among population between the ages 20 and 24 in the United States with a correlation coefficient (R) of 0.275 and weighted average of 75.9%. Similarly, the statistical analysis conducted on geographies consisting of 301,749,902 people shows a poor positive correlation between the proportion of Immigrants from Jamaica and labor force participation rate among population between the ages 20 and 24 in the United States with a correlation coefficient (R) of 0.125 and weighted average of 72.4%, a difference of 4.8%.
In Labor Force | Age 20-24 Correlation Summary
| Measurement | Immigrants from Zimbabwe | Immigrants from Jamaica |
| Minimum | 60.9% | 46.9% |
| Maximum | 100.0% | 100.0% |
| Range | 39.1% | 53.1% |
| Mean | 81.0% | 72.7% |
| Median | 79.2% | 74.1% |
| Interquartile 25% (IQ1) | 75.2% | 67.7% |
| Interquartile 75% (IQ3) | 87.0% | 77.1% |
| Interquartile Range (IQR) | 11.9% | 9.4% |
| Standard Deviation (Sample) | 9.9% | 10.1% |
| Standard Deviation (Population) | 9.7% | 10.0% |
Similar Demographics by In Labor Force | Age 20-24
Demographics Similar to Immigrants from Zimbabwe by In Labor Force | Age 20-24
In terms of in labor force | age 20-24, the demographic groups most similar to Immigrants from Zimbabwe are Alaska Native (75.9%, a difference of 0.0%), Immigrants from Netherlands (75.9%, a difference of 0.010%), Immigrants from North America (75.9%, a difference of 0.010%), Assyrian/Chaldean/Syriac (75.9%, a difference of 0.020%), and Spanish American (75.8%, a difference of 0.020%).
| Demographics | Rating | Rank | In Labor Force | Age 20-24 |
| Greeks | 96.9 /100 | #107 | Exceptional 76.0% |
| Iraqis | 96.6 /100 | #108 | Exceptional 76.0% |
| Cherokee | 95.8 /100 | #109 | Exceptional 75.9% |
| Immigrants | Morocco | 95.8 /100 | #110 | Exceptional 75.9% |
| Ukrainians | 95.7 /100 | #111 | Exceptional 75.9% |
| Immigrants | Canada | 95.6 /100 | #112 | Exceptional 75.9% |
| Immigrants | Netherlands | 95.3 /100 | #113 | Exceptional 75.9% |
| Immigrants | Zimbabwe | 95.1 /100 | #114 | Exceptional 75.9% |
| Alaska Natives | 95.1 /100 | #115 | Exceptional 75.9% |
| Immigrants | North America | 95.0 /100 | #116 | Exceptional 75.9% |
| Assyrians/Chaldeans/Syriacs | 94.9 /100 | #117 | Exceptional 75.9% |
| Spanish Americans | 94.8 /100 | #118 | Exceptional 75.8% |
| Immigrants | Portugal | 94.8 /100 | #119 | Exceptional 75.8% |
| Immigrants | Africa | 94.6 /100 | #120 | Exceptional 75.8% |
| Immigrants | Serbia | 94.3 /100 | #121 | Exceptional 75.8% |
Demographics Similar to Immigrants from Jamaica by In Labor Force | Age 20-24
In terms of in labor force | age 20-24, the demographic groups most similar to Immigrants from Jamaica are Immigrants from Singapore (72.4%, a difference of 0.020%), Immigrants from West Indies (72.4%, a difference of 0.050%), Ecuadorian (72.4%, a difference of 0.060%), Native/Alaskan (72.4%, a difference of 0.070%), and Immigrants from Ecuador (72.3%, a difference of 0.15%).
| Demographics | Rating | Rank | In Labor Force | Age 20-24 |
| Iranians | 0.0 /100 | #299 | Tragic 72.6% |
| Armenians | 0.0 /100 | #300 | Tragic 72.5% |
| Cubans | 0.0 /100 | #301 | Tragic 72.5% |
| Natives/Alaskans | 0.0 /100 | #302 | Tragic 72.4% |
| Ecuadorians | 0.0 /100 | #303 | Tragic 72.4% |
| Immigrants | West Indies | 0.0 /100 | #304 | Tragic 72.4% |
| Immigrants | Singapore | 0.0 /100 | #305 | Tragic 72.4% |
| Immigrants | Jamaica | 0.0 /100 | #306 | Tragic 72.4% |
| Immigrants | Ecuador | 0.0 /100 | #307 | Tragic 72.3% |
| Soviet Union | 0.0 /100 | #308 | Tragic 72.3% |
| Tsimshian | 0.0 /100 | #309 | Tragic 72.3% |
| Immigrants | Cuba | 0.0 /100 | #310 | Tragic 72.0% |
| Apache | 0.0 /100 | #311 | Tragic 72.0% |
| Immigrants | Caribbean | 0.0 /100 | #312 | Tragic 71.9% |
| Immigrants | Dominica | 0.0 /100 | #313 | Tragic 71.9% |