Immigrants from South Africa vs Russian In Labor Force | Age 30-34
COMPARE
Immigrants from South Africa
Russian
In Labor Force | Age 30-34
In Labor Force | Age 30-34 Comparison
Immigrants from South Africa
Russians
85.1%
IN LABOR FORCE | AGE 30-34
95.3/ 100
METRIC RATING
110th/ 347
METRIC RANK
85.5%
IN LABOR FORCE | AGE 30-34
99.6/ 100
METRIC RATING
57th/ 347
METRIC RANK
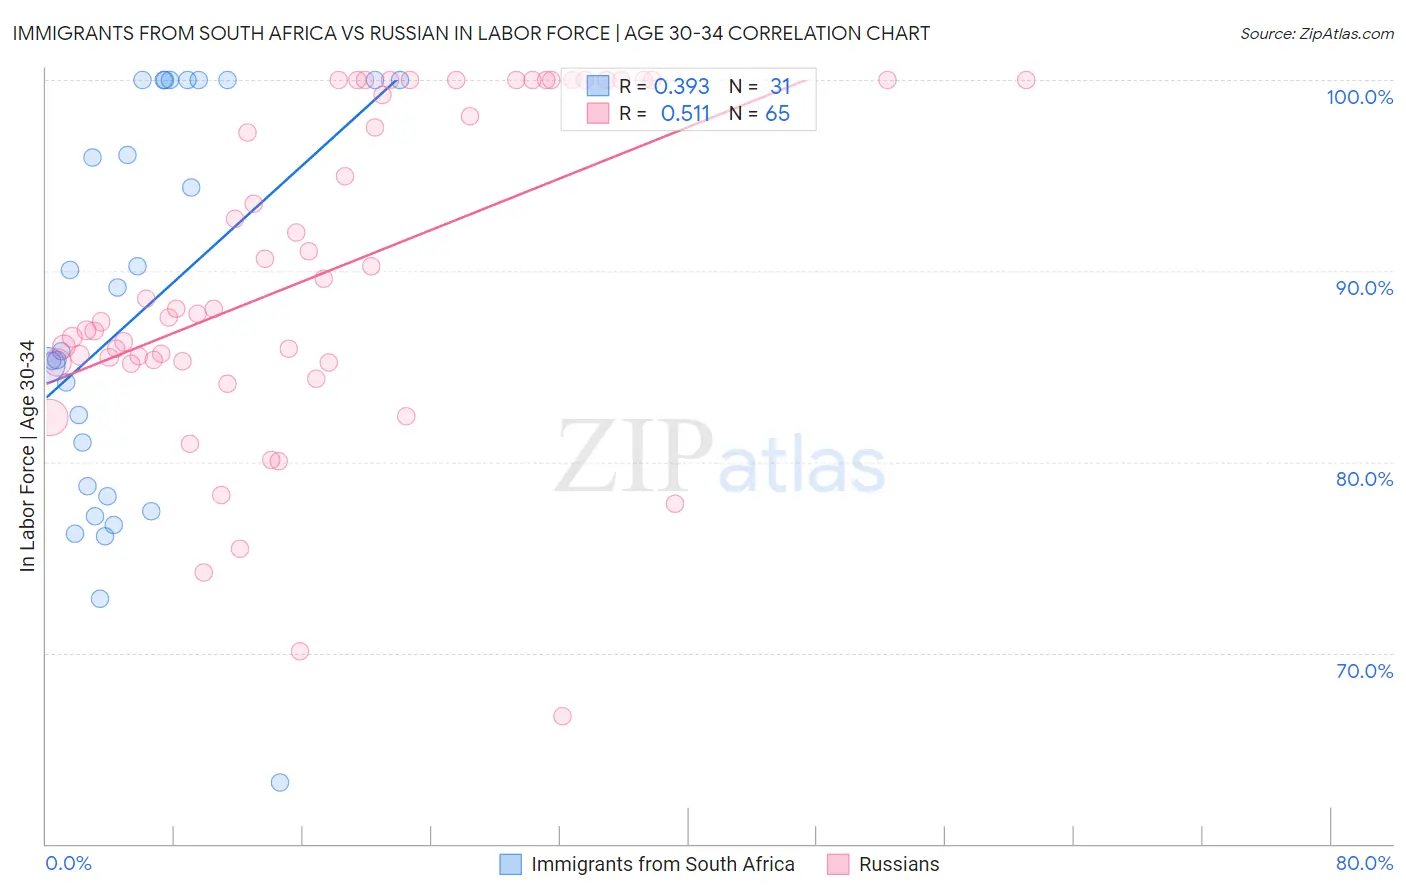
Immigrants from South Africa vs Russian In Labor Force | Age 30-34 Correlation Chart
The statistical analysis conducted on geographies consisting of 233,236,672 people shows a mild positive correlation between the proportion of Immigrants from South Africa and labor force participation rate among population between the ages 30 and 34 in the United States with a correlation coefficient (R) of 0.393 and weighted average of 85.1%. Similarly, the statistical analysis conducted on geographies consisting of 511,538,984 people shows a substantial positive correlation between the proportion of Russians and labor force participation rate among population between the ages 30 and 34 in the United States with a correlation coefficient (R) of 0.511 and weighted average of 85.5%, a difference of 0.43%.
In Labor Force | Age 30-34 Correlation Summary
| Measurement | Immigrants from South Africa | Russian |
| Minimum | 63.2% | 66.7% |
| Maximum | 100.0% | 100.0% |
| Range | 36.8% | 33.3% |
| Mean | 87.8% | 89.9% |
| Median | 85.8% | 88.0% |
| Interquartile 25% (IQ1) | 78.2% | 85.2% |
| Interquartile 75% (IQ3) | 100.0% | 100.0% |
| Interquartile Range (IQR) | 21.8% | 14.8% |
| Standard Deviation (Sample) | 10.4% | 8.5% |
| Standard Deviation (Population) | 10.3% | 8.4% |
Similar Demographics by In Labor Force | Age 30-34
Demographics Similar to Immigrants from South Africa by In Labor Force | Age 30-34
In terms of in labor force | age 30-34, the demographic groups most similar to Immigrants from South Africa are Immigrants from Zimbabwe (85.1%, a difference of 0.020%), Argentinean (85.1%, a difference of 0.020%), Immigrants from Scotland (85.1%, a difference of 0.020%), Immigrants from Hungary (85.1%, a difference of 0.020%), and Immigrants from Romania (85.1%, a difference of 0.020%).
| Demographics | Rating | Rank | In Labor Force | Age 30-34 |
| Ukrainians | 96.6 /100 | #103 | Exceptional 85.2% |
| Immigrants | Ghana | 96.5 /100 | #104 | Exceptional 85.2% |
| Alsatians | 96.3 /100 | #105 | Exceptional 85.2% |
| Immigrants | Middle Africa | 96.3 /100 | #106 | Exceptional 85.2% |
| Immigrants | Northern Africa | 96.3 /100 | #107 | Exceptional 85.2% |
| Immigrants | Zimbabwe | 95.8 /100 | #108 | Exceptional 85.1% |
| Argentineans | 95.8 /100 | #109 | Exceptional 85.1% |
| Immigrants | South Africa | 95.3 /100 | #110 | Exceptional 85.1% |
| Immigrants | Scotland | 94.9 /100 | #111 | Exceptional 85.1% |
| Immigrants | Hungary | 94.8 /100 | #112 | Exceptional 85.1% |
| Immigrants | Romania | 94.7 /100 | #113 | Exceptional 85.1% |
| Yugoslavians | 94.7 /100 | #114 | Exceptional 85.1% |
| Immigrants | South Central Asia | 94.6 /100 | #115 | Exceptional 85.1% |
| Egyptians | 94.5 /100 | #116 | Exceptional 85.1% |
| Immigrants | Denmark | 94.3 /100 | #117 | Exceptional 85.1% |
Demographics Similar to Russians by In Labor Force | Age 30-34
In terms of in labor force | age 30-34, the demographic groups most similar to Russians are Czech (85.5%, a difference of 0.0%), Polish (85.5%, a difference of 0.0%), Immigrants from Kenya (85.5%, a difference of 0.010%), Immigrants from Turkey (85.5%, a difference of 0.010%), and Immigrants from Poland (85.5%, a difference of 0.020%).
| Demographics | Rating | Rank | In Labor Force | Age 30-34 |
| Immigrants | Australia | 99.8 /100 | #50 | Exceptional 85.6% |
| Cape Verdeans | 99.7 /100 | #51 | Exceptional 85.6% |
| Slovenes | 99.7 /100 | #52 | Exceptional 85.6% |
| Filipinos | 99.6 /100 | #53 | Exceptional 85.5% |
| Immigrants | Kenya | 99.6 /100 | #54 | Exceptional 85.5% |
| Immigrants | Turkey | 99.6 /100 | #55 | Exceptional 85.5% |
| Czechs | 99.6 /100 | #56 | Exceptional 85.5% |
| Russians | 99.6 /100 | #57 | Exceptional 85.5% |
| Poles | 99.6 /100 | #58 | Exceptional 85.5% |
| Immigrants | Poland | 99.5 /100 | #59 | Exceptional 85.5% |
| Immigrants | France | 99.5 /100 | #60 | Exceptional 85.5% |
| Immigrants | Brazil | 99.5 /100 | #61 | Exceptional 85.5% |
| Soviet Union | 99.4 /100 | #62 | Exceptional 85.5% |
| Macedonians | 99.4 /100 | #63 | Exceptional 85.5% |
| Italians | 99.4 /100 | #64 | Exceptional 85.4% |