Immigrants from Kazakhstan vs Immigrants from Dominican Republic In Labor Force | Age 30-34
COMPARE
Immigrants from Kazakhstan
Immigrants from Dominican Republic
In Labor Force | Age 30-34
In Labor Force | Age 30-34 Comparison
Immigrants from Kazakhstan
Immigrants from Dominican Republic
85.3%
IN LABOR FORCE | AGE 30-34
98.1/ 100
METRIC RATING
89th/ 347
METRIC RANK
83.8%
IN LABOR FORCE | AGE 30-34
0.3/ 100
METRIC RATING
260th/ 347
METRIC RANK
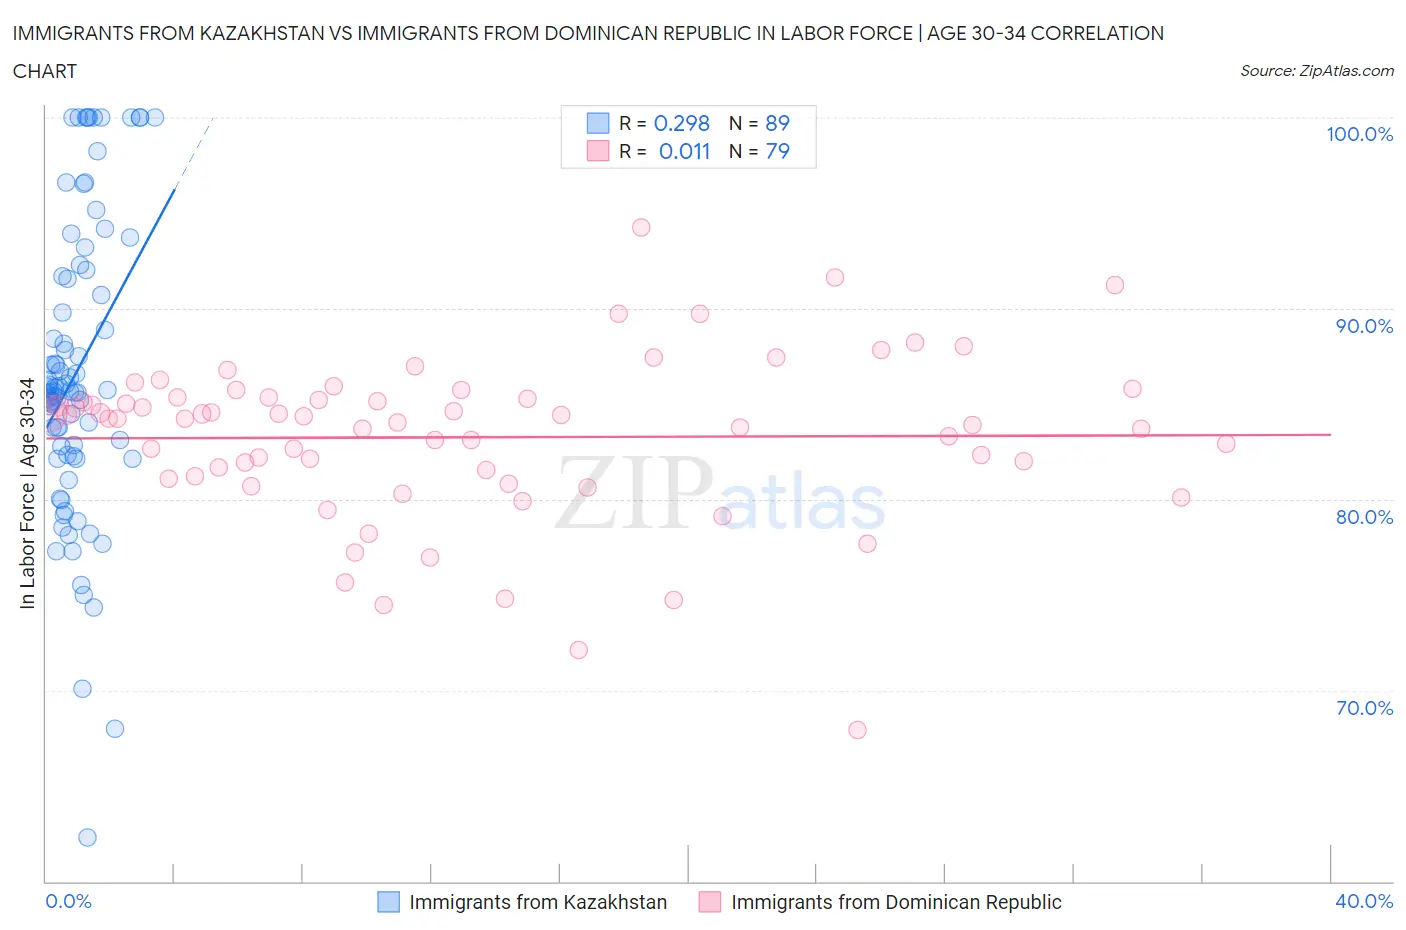
Immigrants from Kazakhstan vs Immigrants from Dominican Republic In Labor Force | Age 30-34 Correlation Chart
The statistical analysis conducted on geographies consisting of 124,415,463 people shows a weak positive correlation between the proportion of Immigrants from Kazakhstan and labor force participation rate among population between the ages 30 and 34 in the United States with a correlation coefficient (R) of 0.298 and weighted average of 85.3%. Similarly, the statistical analysis conducted on geographies consisting of 274,867,457 people shows no correlation between the proportion of Immigrants from Dominican Republic and labor force participation rate among population between the ages 30 and 34 in the United States with a correlation coefficient (R) of 0.011 and weighted average of 83.8%, a difference of 1.8%.
In Labor Force | Age 30-34 Correlation Summary
| Measurement | Immigrants from Kazakhstan | Immigrants from Dominican Republic |
| Minimum | 62.3% | 67.9% |
| Maximum | 100.0% | 94.2% |
| Range | 37.7% | 26.3% |
| Mean | 86.7% | 83.3% |
| Median | 85.7% | 84.2% |
| Interquartile 25% (IQ1) | 82.3% | 81.2% |
| Interquartile 75% (IQ3) | 91.8% | 85.3% |
| Interquartile Range (IQR) | 9.5% | 4.1% |
| Standard Deviation (Sample) | 7.8% | 4.3% |
| Standard Deviation (Population) | 7.8% | 4.3% |
Similar Demographics by In Labor Force | Age 30-34
Demographics Similar to Immigrants from Kazakhstan by In Labor Force | Age 30-34
In terms of in labor force | age 30-34, the demographic groups most similar to Immigrants from Kazakhstan are Immigrants from Northern Europe (85.3%, a difference of 0.010%), Immigrants from Belgium (85.3%, a difference of 0.010%), Immigrants from Taiwan (85.3%, a difference of 0.020%), Burmese (85.3%, a difference of 0.020%), and Immigrants from Moldova (85.3%, a difference of 0.020%).
| Demographics | Rating | Rank | In Labor Force | Age 30-34 |
| Immigrants | Africa | 98.6 /100 | #82 | Exceptional 85.3% |
| Immigrants | Europe | 98.6 /100 | #83 | Exceptional 85.3% |
| Greeks | 98.6 /100 | #84 | Exceptional 85.3% |
| Mongolians | 98.5 /100 | #85 | Exceptional 85.3% |
| Immigrants | Taiwan | 98.3 /100 | #86 | Exceptional 85.3% |
| Immigrants | Northern Europe | 98.2 /100 | #87 | Exceptional 85.3% |
| Immigrants | Belgium | 98.2 /100 | #88 | Exceptional 85.3% |
| Immigrants | Kazakhstan | 98.1 /100 | #89 | Exceptional 85.3% |
| Burmese | 97.9 /100 | #90 | Exceptional 85.3% |
| Immigrants | Moldova | 97.9 /100 | #91 | Exceptional 85.3% |
| German Russians | 97.7 /100 | #92 | Exceptional 85.2% |
| Immigrants | Norway | 97.6 /100 | #93 | Exceptional 85.2% |
| Swedes | 97.5 /100 | #94 | Exceptional 85.2% |
| Immigrants | India | 97.4 /100 | #95 | Exceptional 85.2% |
| Immigrants | Korea | 97.3 /100 | #96 | Exceptional 85.2% |
Demographics Similar to Immigrants from Dominican Republic by In Labor Force | Age 30-34
In terms of in labor force | age 30-34, the demographic groups most similar to Immigrants from Dominican Republic are Guyanese (83.8%, a difference of 0.010%), Honduran (83.8%, a difference of 0.020%), Scotch-Irish (83.8%, a difference of 0.020%), Dominican (83.8%, a difference of 0.020%), and Immigrants from Guyana (83.8%, a difference of 0.030%).
| Demographics | Rating | Rank | In Labor Force | Age 30-34 |
| Immigrants | Nicaragua | 0.6 /100 | #253 | Tragic 83.9% |
| Immigrants | St. Vincent and the Grenadines | 0.5 /100 | #254 | Tragic 83.9% |
| Whites/Caucasians | 0.5 /100 | #255 | Tragic 83.9% |
| Immigrants | Lebanon | 0.4 /100 | #256 | Tragic 83.9% |
| Iraqis | 0.3 /100 | #257 | Tragic 83.8% |
| Hondurans | 0.3 /100 | #258 | Tragic 83.8% |
| Scotch-Irish | 0.3 /100 | #259 | Tragic 83.8% |
| Immigrants | Dominican Republic | 0.3 /100 | #260 | Tragic 83.8% |
| Guyanese | 0.3 /100 | #261 | Tragic 83.8% |
| Dominicans | 0.2 /100 | #262 | Tragic 83.8% |
| Immigrants | Guyana | 0.2 /100 | #263 | Tragic 83.8% |
| Guatemalans | 0.2 /100 | #264 | Tragic 83.7% |
| Immigrants | Honduras | 0.1 /100 | #265 | Tragic 83.7% |
| Immigrants | Guatemala | 0.1 /100 | #266 | Tragic 83.7% |
| Spaniards | 0.1 /100 | #267 | Tragic 83.6% |