Pennsylvania German vs Immigrants from Liberia In Labor Force | Age 16-19
COMPARE
Pennsylvania German
Immigrants from Liberia
In Labor Force | Age 16-19
In Labor Force | Age 16-19 Comparison
Pennsylvania Germans
Immigrants from Liberia
46.4%
IN LABOR FORCE | AGE 16-19
100.0/ 100
METRIC RATING
1st/ 347
METRIC RANK
41.5%
IN LABOR FORCE | AGE 16-19
100.0/ 100
METRIC RATING
40th/ 347
METRIC RANK
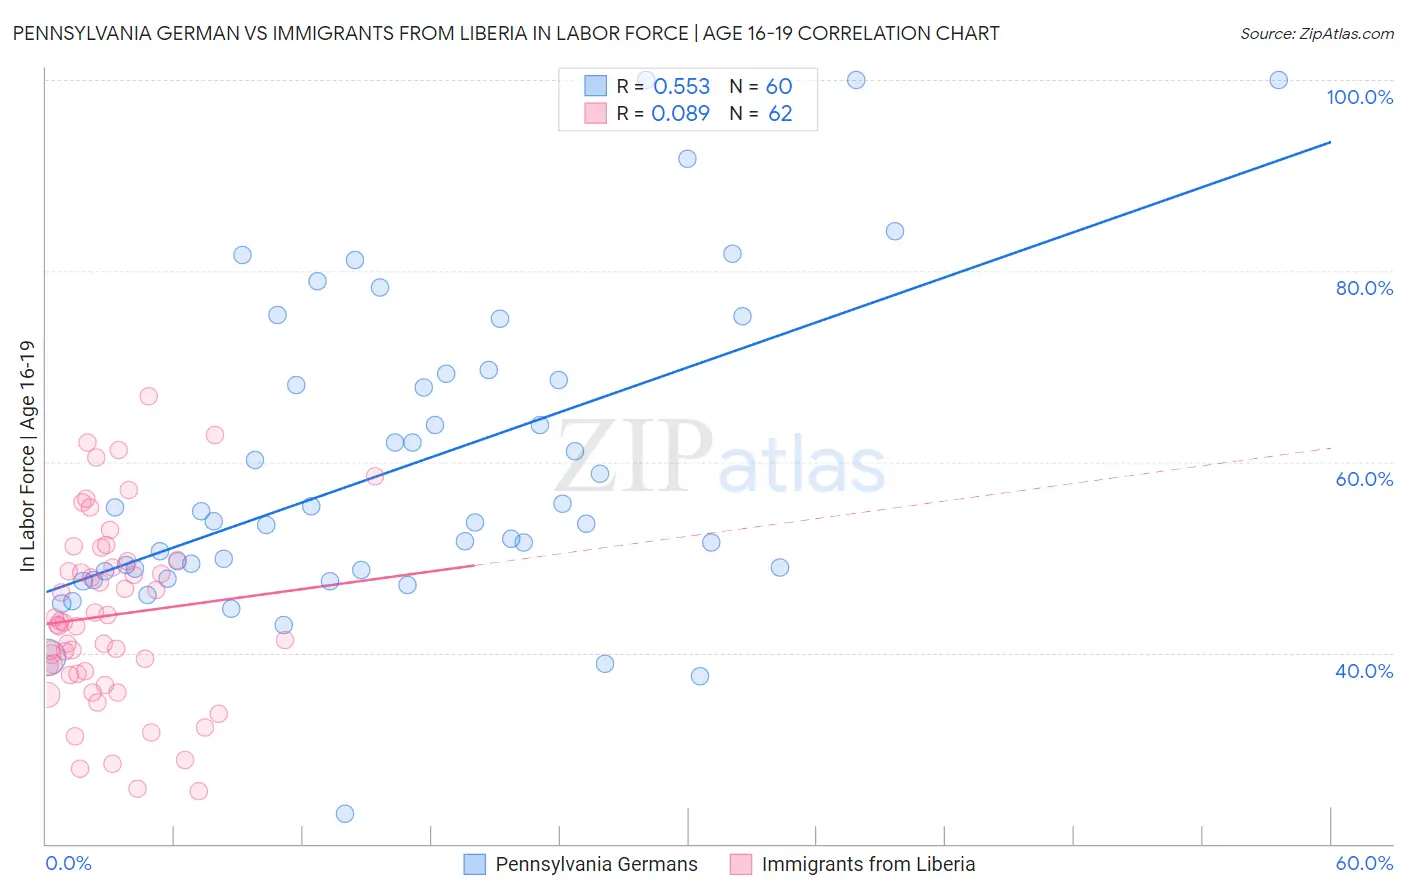
Pennsylvania German vs Immigrants from Liberia In Labor Force | Age 16-19 Correlation Chart
The statistical analysis conducted on geographies consisting of 233,701,573 people shows a substantial positive correlation between the proportion of Pennsylvania Germans and labor force participation rate among population between the ages 16 and 19 in the United States with a correlation coefficient (R) of 0.553 and weighted average of 46.4%. Similarly, the statistical analysis conducted on geographies consisting of 135,255,141 people shows a slight positive correlation between the proportion of Immigrants from Liberia and labor force participation rate among population between the ages 16 and 19 in the United States with a correlation coefficient (R) of 0.089 and weighted average of 41.5%, a difference of 12.0%.
In Labor Force | Age 16-19 Correlation Summary
| Measurement | Pennsylvania German | Immigrants from Liberia |
| Minimum | 23.1% | 25.5% |
| Maximum | 100.0% | 66.9% |
| Range | 76.9% | 41.4% |
| Mean | 59.4% | 43.9% |
| Median | 53.7% | 43.0% |
| Interquartile 25% (IQ1) | 48.6% | 37.8% |
| Interquartile 75% (IQ3) | 68.9% | 49.6% |
| Interquartile Range (IQR) | 20.3% | 11.8% |
| Standard Deviation (Sample) | 16.4% | 9.6% |
| Standard Deviation (Population) | 16.2% | 9.5% |
Similar Demographics by In Labor Force | Age 16-19
Demographics Similar to Pennsylvania Germans by In Labor Force | Age 16-19
In terms of in labor force | age 16-19, the demographic groups most similar to Pennsylvania Germans are Norwegian (46.2%, a difference of 0.56%), Immigrants from Somalia (45.6%, a difference of 1.9%), Luxembourger (45.3%, a difference of 2.5%), Alaskan Athabascan (45.2%, a difference of 2.7%), and Somali (45.1%, a difference of 2.9%).
| Demographics | Rating | Rank | In Labor Force | Age 16-19 |
| Pennsylvania Germans | 100.0 /100 | #1 | Exceptional 46.4% |
| Norwegians | 100.0 /100 | #2 | Exceptional 46.2% |
| Immigrants | Somalia | 100.0 /100 | #3 | Exceptional 45.6% |
| Luxembourgers | 100.0 /100 | #4 | Exceptional 45.3% |
| Alaskan Athabascans | 100.0 /100 | #5 | Exceptional 45.2% |
| Somalis | 100.0 /100 | #6 | Exceptional 45.1% |
| Danes | 100.0 /100 | #7 | Exceptional 44.7% |
| Immigrants | Cabo Verde | 100.0 /100 | #8 | Exceptional 44.7% |
| Cape Verdeans | 100.0 /100 | #9 | Exceptional 44.5% |
| Germans | 100.0 /100 | #10 | Exceptional 44.2% |
| Swedes | 100.0 /100 | #11 | Exceptional 44.1% |
| Finns | 100.0 /100 | #12 | Exceptional 43.9% |
| Dutch | 100.0 /100 | #13 | Exceptional 43.8% |
| Chippewa | 100.0 /100 | #14 | Exceptional 43.8% |
| Slovenes | 100.0 /100 | #15 | Exceptional 43.7% |
Demographics Similar to Immigrants from Liberia by In Labor Force | Age 16-19
In terms of in labor force | age 16-19, the demographic groups most similar to Immigrants from Liberia are Scotch-Irish (41.5%, a difference of 0.10%), Sioux (41.5%, a difference of 0.23%), Celtic (41.3%, a difference of 0.34%), White/Caucasian (41.3%, a difference of 0.35%), and Immigrants from Congo (41.7%, a difference of 0.58%).
| Demographics | Rating | Rank | In Labor Force | Age 16-19 |
| Liberians | 100.0 /100 | #33 | Exceptional 41.8% |
| Immigrants | Bosnia and Herzegovina | 100.0 /100 | #34 | Exceptional 41.8% |
| Yugoslavians | 100.0 /100 | #35 | Exceptional 41.8% |
| Immigrants | Azores | 100.0 /100 | #36 | Exceptional 41.7% |
| Immigrants | Congo | 100.0 /100 | #37 | Exceptional 41.7% |
| Sioux | 100.0 /100 | #38 | Exceptional 41.5% |
| Scotch-Irish | 100.0 /100 | #39 | Exceptional 41.5% |
| Immigrants | Liberia | 100.0 /100 | #40 | Exceptional 41.5% |
| Celtics | 100.0 /100 | #41 | Exceptional 41.3% |
| Whites/Caucasians | 100.0 /100 | #42 | Exceptional 41.3% |
| Tongans | 100.0 /100 | #43 | Exceptional 41.2% |
| Europeans | 100.0 /100 | #44 | Exceptional 41.1% |
| Croatians | 100.0 /100 | #45 | Exceptional 41.1% |
| Immigrants | Sudan | 100.0 /100 | #46 | Exceptional 41.0% |
| Carpatho Rusyns | 100.0 /100 | #47 | Exceptional 40.8% |