Immigrants from Malaysia vs Indonesian In Labor Force | Age 16-19
COMPARE
Immigrants from Malaysia
Indonesian
In Labor Force | Age 16-19
In Labor Force | Age 16-19 Comparison
Immigrants from Malaysia
Indonesians
34.3%
IN LABOR FORCE | AGE 16-19
0.7/ 100
METRIC RATING
266th/ 347
METRIC RANK
40.7%
IN LABOR FORCE | AGE 16-19
100.0/ 100
METRIC RATING
50th/ 347
METRIC RANK
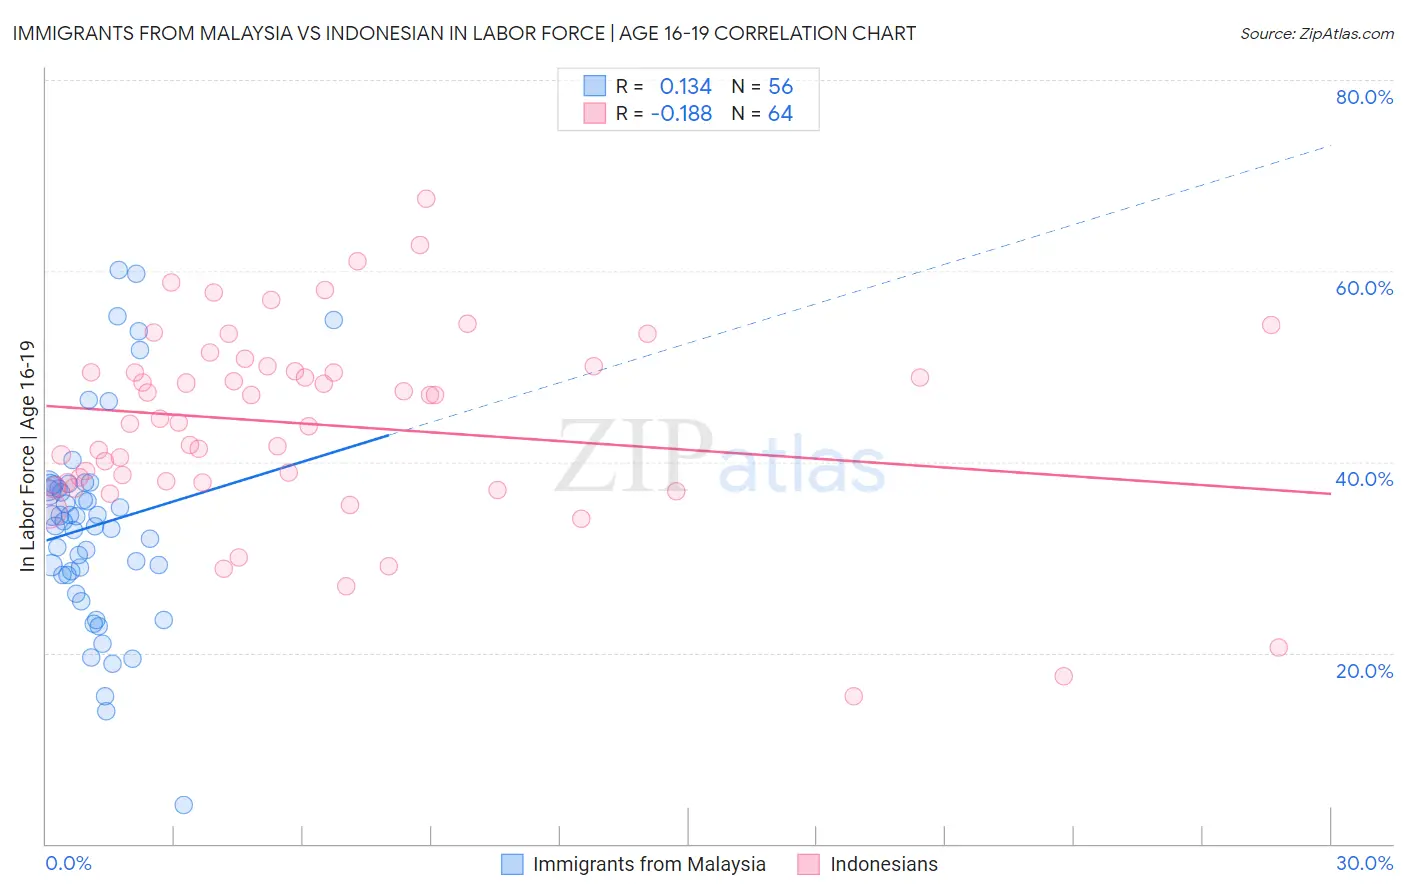
Immigrants from Malaysia vs Indonesian In Labor Force | Age 16-19 Correlation Chart
The statistical analysis conducted on geographies consisting of 197,895,635 people shows a poor positive correlation between the proportion of Immigrants from Malaysia and labor force participation rate among population between the ages 16 and 19 in the United States with a correlation coefficient (R) of 0.134 and weighted average of 34.3%. Similarly, the statistical analysis conducted on geographies consisting of 162,704,149 people shows a poor negative correlation between the proportion of Indonesians and labor force participation rate among population between the ages 16 and 19 in the United States with a correlation coefficient (R) of -0.188 and weighted average of 40.7%, a difference of 18.8%.
In Labor Force | Age 16-19 Correlation Summary
| Measurement | Immigrants from Malaysia | Indonesian |
| Minimum | 4.0% | 15.4% |
| Maximum | 60.1% | 67.6% |
| Range | 56.1% | 52.2% |
| Mean | 33.4% | 43.9% |
| Median | 33.6% | 44.3% |
| Interquartile 25% (IQ1) | 28.1% | 37.8% |
| Interquartile 75% (IQ3) | 37.5% | 49.8% |
| Interquartile Range (IQR) | 9.4% | 11.9% |
| Standard Deviation (Sample) | 11.0% | 10.3% |
| Standard Deviation (Population) | 10.9% | 10.2% |
Similar Demographics by In Labor Force | Age 16-19
Demographics Similar to Immigrants from Malaysia by In Labor Force | Age 16-19
In terms of in labor force | age 16-19, the demographic groups most similar to Immigrants from Malaysia are Immigrants from El Salvador (34.3%, a difference of 0.090%), Immigrants from Uruguay (34.4%, a difference of 0.33%), Immigrants from Peru (34.2%, a difference of 0.36%), Immigrants from Asia (34.1%, a difference of 0.48%), and Pima (34.1%, a difference of 0.56%).
| Demographics | Rating | Rank | In Labor Force | Age 16-19 |
| Immigrants | Immigrants | 1.2 /100 | #259 | Tragic 34.6% |
| Egyptians | 1.2 /100 | #260 | Tragic 34.5% |
| Salvadorans | 1.1 /100 | #261 | Tragic 34.5% |
| Hispanics or Latinos | 1.1 /100 | #262 | Tragic 34.5% |
| Burmese | 1.1 /100 | #263 | Tragic 34.5% |
| Immigrants | Uruguay | 0.9 /100 | #264 | Tragic 34.4% |
| Immigrants | El Salvador | 0.7 /100 | #265 | Tragic 34.3% |
| Immigrants | Malaysia | 0.7 /100 | #266 | Tragic 34.3% |
| Immigrants | Peru | 0.5 /100 | #267 | Tragic 34.2% |
| Immigrants | Asia | 0.5 /100 | #268 | Tragic 34.1% |
| Pima | 0.5 /100 | #269 | Tragic 34.1% |
| Immigrants | Russia | 0.4 /100 | #270 | Tragic 34.1% |
| Central American Indians | 0.4 /100 | #271 | Tragic 34.1% |
| Asians | 0.4 /100 | #272 | Tragic 34.1% |
| Immigrants | Panama | 0.4 /100 | #273 | Tragic 34.0% |
Demographics Similar to Indonesians by In Labor Force | Age 16-19
In terms of in labor force | age 16-19, the demographic groups most similar to Indonesians are Immigrants from Zaire (40.7%, a difference of 0.10%), Cree (40.8%, a difference of 0.16%), Icelander (40.8%, a difference of 0.18%), Immigrants from Laos (40.6%, a difference of 0.19%), and Carpatho Rusyn (40.8%, a difference of 0.23%).
| Demographics | Rating | Rank | In Labor Force | Age 16-19 |
| Tongans | 100.0 /100 | #43 | Exceptional 41.2% |
| Europeans | 100.0 /100 | #44 | Exceptional 41.1% |
| Croatians | 100.0 /100 | #45 | Exceptional 41.1% |
| Immigrants | Sudan | 100.0 /100 | #46 | Exceptional 41.0% |
| Carpatho Rusyns | 100.0 /100 | #47 | Exceptional 40.8% |
| Icelanders | 100.0 /100 | #48 | Exceptional 40.8% |
| Cree | 100.0 /100 | #49 | Exceptional 40.8% |
| Indonesians | 100.0 /100 | #50 | Exceptional 40.7% |
| Immigrants | Zaire | 100.0 /100 | #51 | Exceptional 40.7% |
| Immigrants | Laos | 100.0 /100 | #52 | Exceptional 40.6% |
| Immigrants | Kenya | 100.0 /100 | #53 | Exceptional 40.5% |
| Tlingit-Haida | 100.0 /100 | #54 | Exceptional 40.5% |
| British | 100.0 /100 | #55 | Exceptional 40.5% |
| Fijians | 100.0 /100 | #56 | Exceptional 40.4% |
| Lithuanians | 100.0 /100 | #57 | Exceptional 40.4% |