Immigrants from Dominican Republic vs Indonesian In Labor Force | Age 16-19
COMPARE
Immigrants from Dominican Republic
Indonesian
In Labor Force | Age 16-19
In Labor Force | Age 16-19 Comparison
Immigrants from Dominican Republic
Indonesians
31.1%
IN LABOR FORCE | AGE 16-19
0.0/ 100
METRIC RATING
326th/ 347
METRIC RANK
40.7%
IN LABOR FORCE | AGE 16-19
100.0/ 100
METRIC RATING
50th/ 347
METRIC RANK
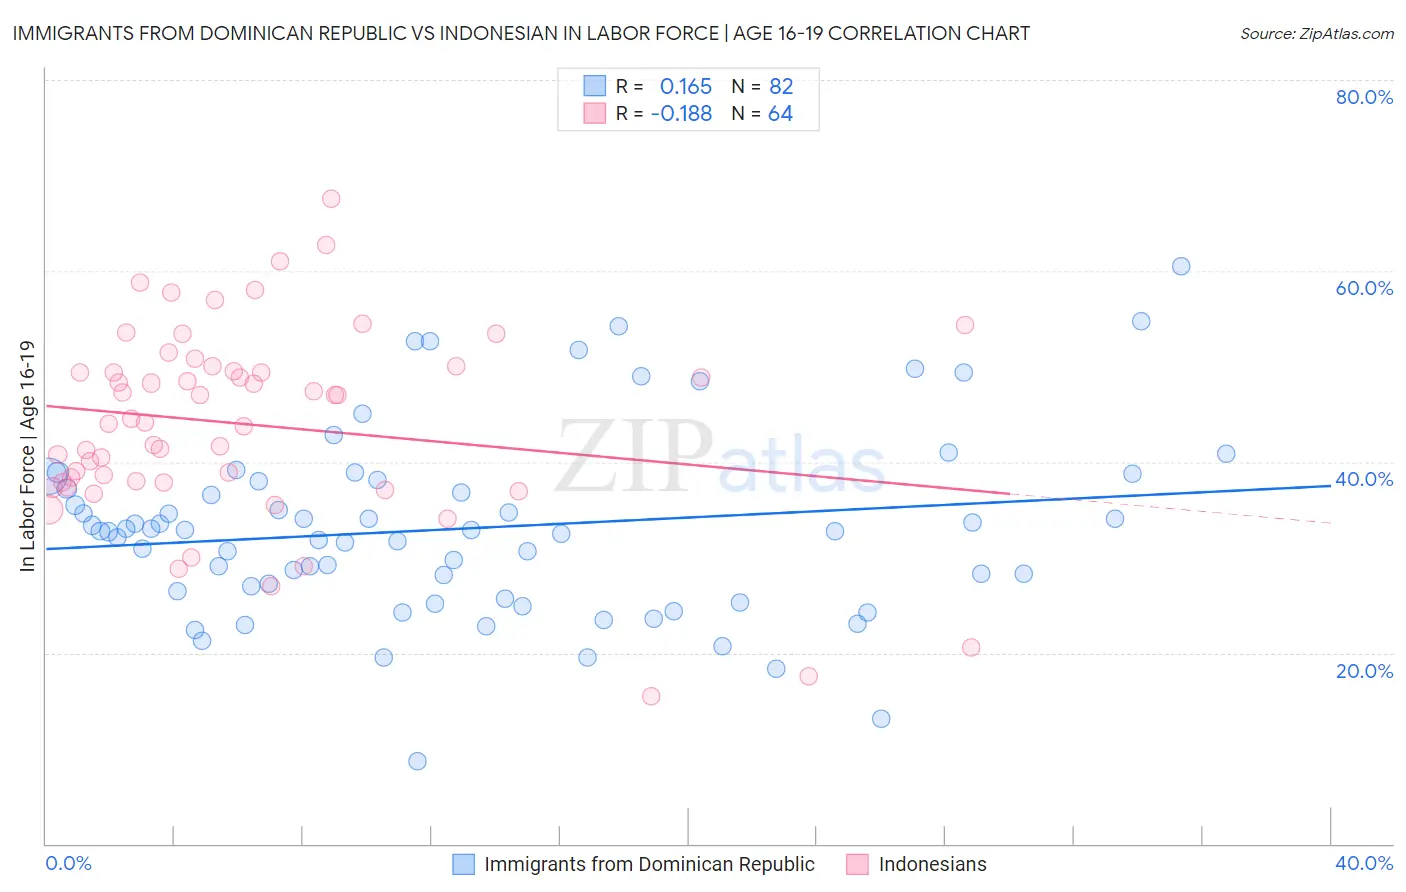
Immigrants from Dominican Republic vs Indonesian In Labor Force | Age 16-19 Correlation Chart
The statistical analysis conducted on geographies consisting of 274,798,225 people shows a poor positive correlation between the proportion of Immigrants from Dominican Republic and labor force participation rate among population between the ages 16 and 19 in the United States with a correlation coefficient (R) of 0.165 and weighted average of 31.1%. Similarly, the statistical analysis conducted on geographies consisting of 162,704,149 people shows a poor negative correlation between the proportion of Indonesians and labor force participation rate among population between the ages 16 and 19 in the United States with a correlation coefficient (R) of -0.188 and weighted average of 40.7%, a difference of 31.0%.
In Labor Force | Age 16-19 Correlation Summary
| Measurement | Immigrants from Dominican Republic | Indonesian |
| Minimum | 8.7% | 15.4% |
| Maximum | 60.5% | 67.6% |
| Range | 51.8% | 52.2% |
| Mean | 33.0% | 43.9% |
| Median | 32.7% | 44.3% |
| Interquartile 25% (IQ1) | 26.5% | 37.8% |
| Interquartile 75% (IQ3) | 38.0% | 49.8% |
| Interquartile Range (IQR) | 11.5% | 11.9% |
| Standard Deviation (Sample) | 9.7% | 10.3% |
| Standard Deviation (Population) | 9.7% | 10.2% |
Similar Demographics by In Labor Force | Age 16-19
Demographics Similar to Immigrants from Dominican Republic by In Labor Force | Age 16-19
In terms of in labor force | age 16-19, the demographic groups most similar to Immigrants from Dominican Republic are Immigrants from Taiwan (31.0%, a difference of 0.16%), Immigrants from China (31.1%, a difference of 0.20%), Immigrants from Ecuador (31.0%, a difference of 0.20%), Barbadian (31.0%, a difference of 0.23%), and Dominican (31.2%, a difference of 0.35%).
| Demographics | Rating | Rank | In Labor Force | Age 16-19 |
| Soviet Union | 0.0 /100 | #319 | Tragic 31.4% |
| Ecuadorians | 0.0 /100 | #320 | Tragic 31.4% |
| West Indians | 0.0 /100 | #321 | Tragic 31.3% |
| Tohono O'odham | 0.0 /100 | #322 | Tragic 31.3% |
| Immigrants | Caribbean | 0.0 /100 | #323 | Tragic 31.2% |
| Dominicans | 0.0 /100 | #324 | Tragic 31.2% |
| Immigrants | China | 0.0 /100 | #325 | Tragic 31.1% |
| Immigrants | Dominican Republic | 0.0 /100 | #326 | Tragic 31.1% |
| Immigrants | Taiwan | 0.0 /100 | #327 | Tragic 31.0% |
| Immigrants | Ecuador | 0.0 /100 | #328 | Tragic 31.0% |
| Barbadians | 0.0 /100 | #329 | Tragic 31.0% |
| Lumbee | 0.0 /100 | #330 | Tragic 31.0% |
| Trinidadians and Tobagonians | 0.0 /100 | #331 | Tragic 30.9% |
| Immigrants | Israel | 0.0 /100 | #332 | Tragic 30.5% |
| Immigrants | Hong Kong | 0.0 /100 | #333 | Tragic 30.5% |
Demographics Similar to Indonesians by In Labor Force | Age 16-19
In terms of in labor force | age 16-19, the demographic groups most similar to Indonesians are Immigrants from Zaire (40.7%, a difference of 0.10%), Cree (40.8%, a difference of 0.16%), Icelander (40.8%, a difference of 0.18%), Immigrants from Laos (40.6%, a difference of 0.19%), and Carpatho Rusyn (40.8%, a difference of 0.23%).
| Demographics | Rating | Rank | In Labor Force | Age 16-19 |
| Tongans | 100.0 /100 | #43 | Exceptional 41.2% |
| Europeans | 100.0 /100 | #44 | Exceptional 41.1% |
| Croatians | 100.0 /100 | #45 | Exceptional 41.1% |
| Immigrants | Sudan | 100.0 /100 | #46 | Exceptional 41.0% |
| Carpatho Rusyns | 100.0 /100 | #47 | Exceptional 40.8% |
| Icelanders | 100.0 /100 | #48 | Exceptional 40.8% |
| Cree | 100.0 /100 | #49 | Exceptional 40.8% |
| Indonesians | 100.0 /100 | #50 | Exceptional 40.7% |
| Immigrants | Zaire | 100.0 /100 | #51 | Exceptional 40.7% |
| Immigrants | Laos | 100.0 /100 | #52 | Exceptional 40.6% |
| Immigrants | Kenya | 100.0 /100 | #53 | Exceptional 40.5% |
| Tlingit-Haida | 100.0 /100 | #54 | Exceptional 40.5% |
| British | 100.0 /100 | #55 | Exceptional 40.5% |
| Fijians | 100.0 /100 | #56 | Exceptional 40.4% |
| Lithuanians | 100.0 /100 | #57 | Exceptional 40.4% |