Paraguayan vs Immigrants from Italy 5th Grade
COMPARE
Paraguayan
Immigrants from Italy
5th Grade
5th Grade Comparison
Paraguayans
Immigrants from Italy
97.3%
5TH GRADE
33.7/ 100
METRIC RATING
188th/ 347
METRIC RANK
97.4%
5TH GRADE
65.2/ 100
METRIC RATING
159th/ 347
METRIC RANK
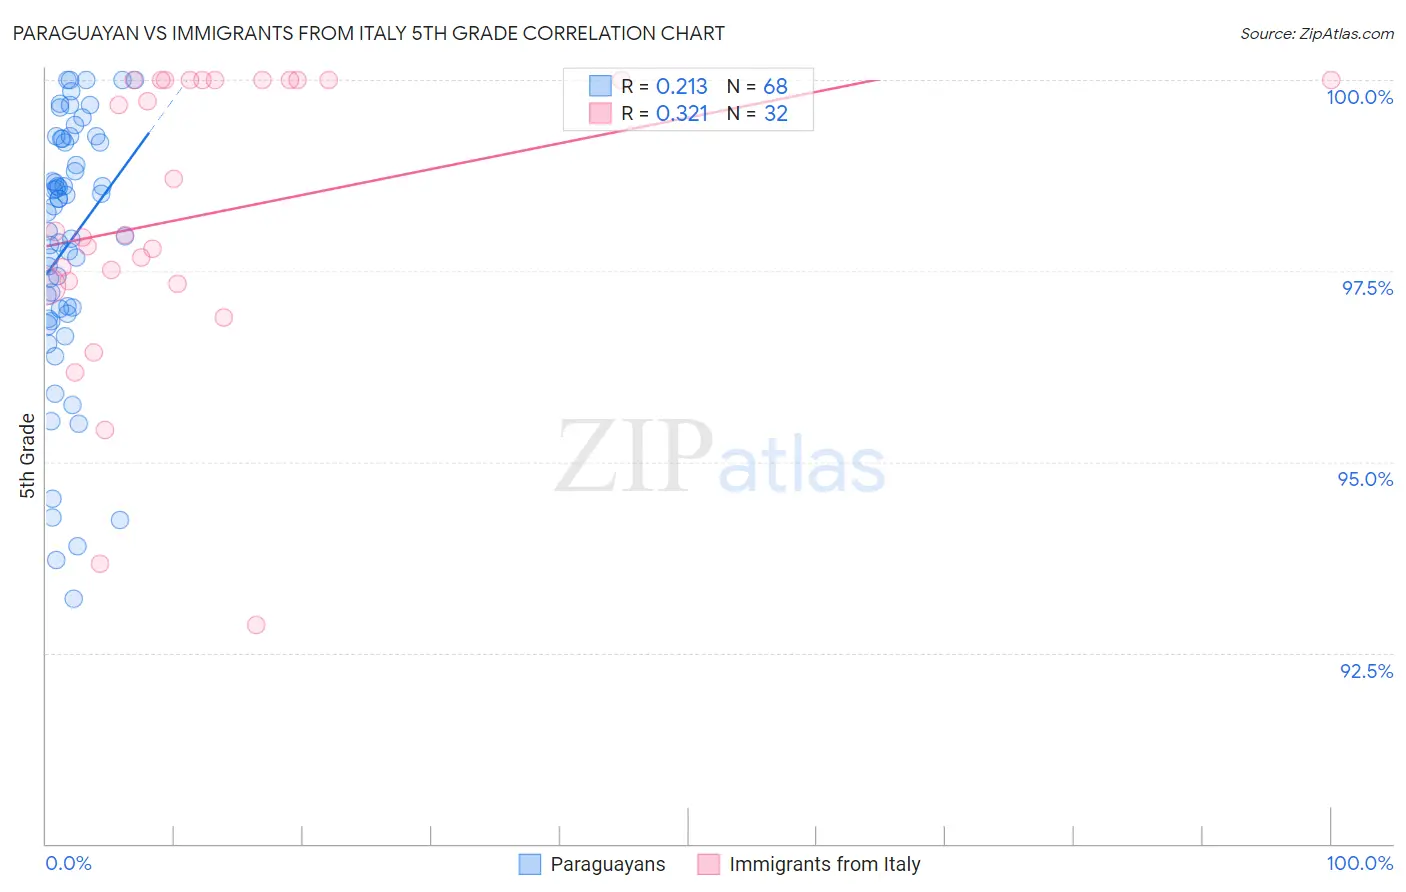
Paraguayan vs Immigrants from Italy 5th Grade Correlation Chart
The statistical analysis conducted on geographies consisting of 95,115,093 people shows a weak positive correlation between the proportion of Paraguayans and percentage of population with at least 5th grade education in the United States with a correlation coefficient (R) of 0.213 and weighted average of 97.3%. Similarly, the statistical analysis conducted on geographies consisting of 324,226,009 people shows a mild positive correlation between the proportion of Immigrants from Italy and percentage of population with at least 5th grade education in the United States with a correlation coefficient (R) of 0.321 and weighted average of 97.4%, a difference of 0.14%.
5th Grade Correlation Summary
| Measurement | Paraguayan | Immigrants from Italy |
| Minimum | 93.2% | 92.9% |
| Maximum | 100.0% | 100.0% |
| Range | 6.8% | 7.1% |
| Mean | 97.8% | 98.2% |
| Median | 98.3% | 98.0% |
| Interquartile 25% (IQ1) | 97.0% | 97.3% |
| Interquartile 75% (IQ3) | 99.2% | 100.0% |
| Interquartile Range (IQR) | 2.2% | 2.7% |
| Standard Deviation (Sample) | 1.7% | 1.9% |
| Standard Deviation (Population) | 1.7% | 1.9% |
Similar Demographics by 5th Grade
Demographics Similar to Paraguayans by 5th Grade
In terms of 5th grade, the demographic groups most similar to Paraguayans are Spanish American (97.3%, a difference of 0.0%), Immigrants from Egypt (97.3%, a difference of 0.0%), Dutch West Indian (97.3%, a difference of 0.010%), Immigrants from Argentina (97.3%, a difference of 0.010%), and Black/African American (97.3%, a difference of 0.010%).
| Demographics | Rating | Rank | 5th Grade |
| Argentineans | 39.5 /100 | #181 | Fair 97.3% |
| Mongolians | 39.4 /100 | #182 | Fair 97.3% |
| Immigrants | Ukraine | 38.6 /100 | #183 | Fair 97.3% |
| Immigrants | Venezuela | 38.4 /100 | #184 | Fair 97.3% |
| Dutch West Indians | 36.2 /100 | #185 | Fair 97.3% |
| Immigrants | Argentina | 36.1 /100 | #186 | Fair 97.3% |
| Spanish Americans | 34.7 /100 | #187 | Fair 97.3% |
| Paraguayans | 33.7 /100 | #188 | Fair 97.3% |
| Immigrants | Egypt | 32.9 /100 | #189 | Fair 97.3% |
| Blacks/African Americans | 31.8 /100 | #190 | Fair 97.3% |
| Immigrants | Brazil | 31.5 /100 | #191 | Fair 97.3% |
| Panamanians | 31.3 /100 | #192 | Fair 97.3% |
| Navajo | 29.0 /100 | #193 | Fair 97.2% |
| Immigrants | Albania | 28.5 /100 | #194 | Fair 97.2% |
| Guamanians/Chamorros | 26.8 /100 | #195 | Fair 97.2% |
Demographics Similar to Immigrants from Italy by 5th Grade
In terms of 5th grade, the demographic groups most similar to Immigrants from Italy are Albanian (97.4%, a difference of 0.010%), French American Indian (97.4%, a difference of 0.020%), Immigrants from Jordan (97.4%, a difference of 0.020%), Marshallese (97.4%, a difference of 0.020%), and Kenyan (97.4%, a difference of 0.020%).
| Demographics | Rating | Rank | 5th Grade |
| Ute | 74.9 /100 | #152 | Good 97.4% |
| Alsatians | 74.3 /100 | #153 | Good 97.4% |
| Immigrants | Russia | 71.2 /100 | #154 | Good 97.4% |
| Immigrants | Bosnia and Herzegovina | 71.0 /100 | #155 | Good 97.4% |
| French American Indians | 70.5 /100 | #156 | Good 97.4% |
| Immigrants | Jordan | 70.4 /100 | #157 | Good 97.4% |
| Albanians | 68.3 /100 | #158 | Good 97.4% |
| Immigrants | Italy | 65.2 /100 | #159 | Good 97.4% |
| Marshallese | 61.2 /100 | #160 | Good 97.4% |
| Kenyans | 59.7 /100 | #161 | Average 97.4% |
| Immigrants | Iran | 59.5 /100 | #162 | Average 97.4% |
| Ugandans | 58.9 /100 | #163 | Average 97.4% |
| Bermudans | 58.8 /100 | #164 | Average 97.4% |
| Immigrants | Poland | 57.9 /100 | #165 | Average 97.4% |
| Apache | 57.2 /100 | #166 | Average 97.4% |