Paraguayan vs Immigrants from Italy 9th Grade
COMPARE
Paraguayan
Immigrants from Italy
9th Grade
9th Grade Comparison
Paraguayans
Immigrants from Italy
94.7%
9TH GRADE
30.1/ 100
METRIC RATING
193rd/ 347
METRIC RANK
95.0%
9TH GRADE
66.6/ 100
METRIC RATING
160th/ 347
METRIC RANK
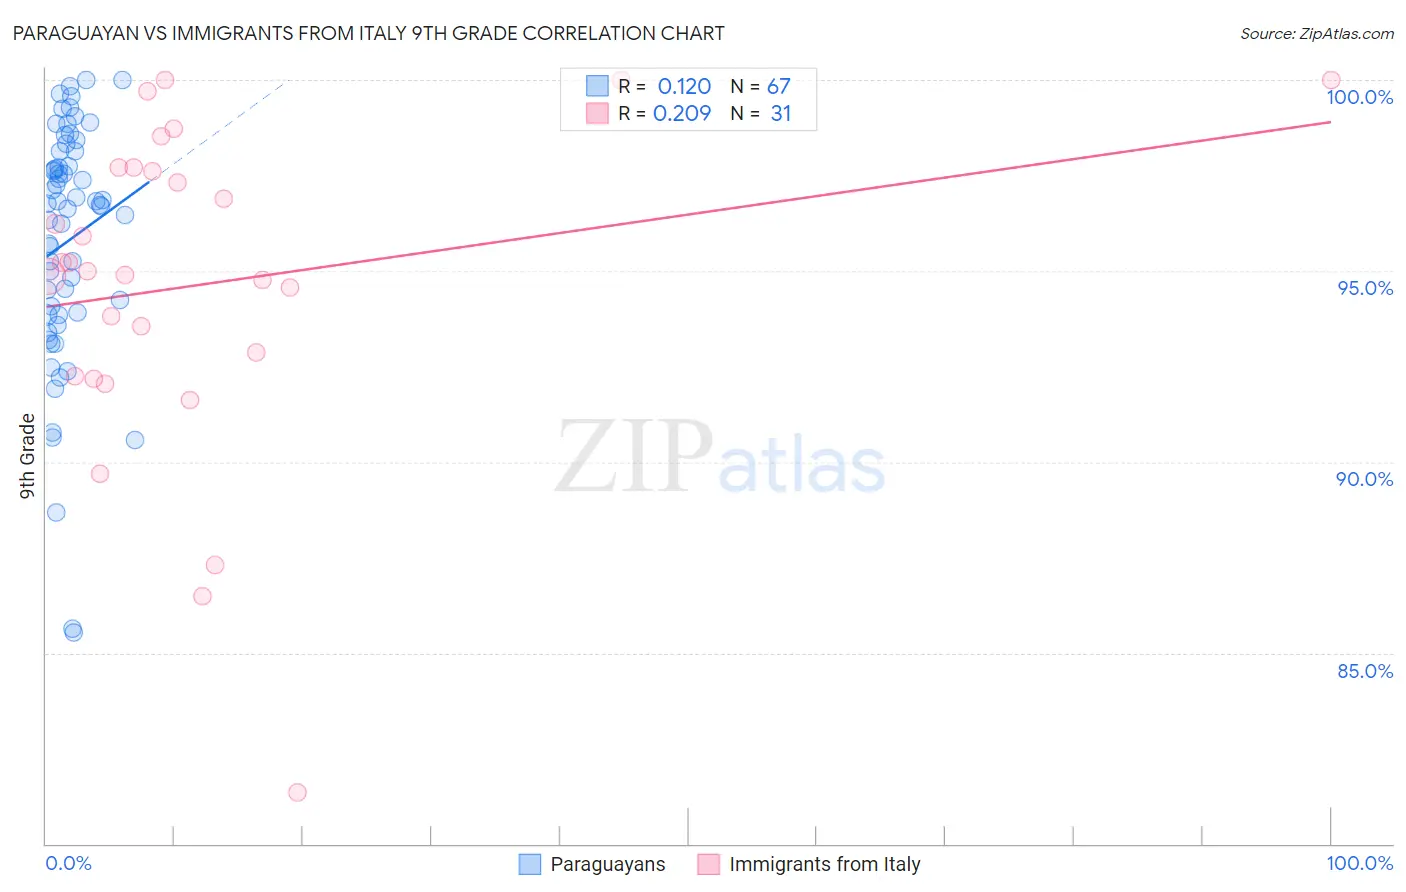
Paraguayan vs Immigrants from Italy 9th Grade Correlation Chart
The statistical analysis conducted on geographies consisting of 95,114,701 people shows a poor positive correlation between the proportion of Paraguayans and percentage of population with at least 9th grade education in the United States with a correlation coefficient (R) of 0.120 and weighted average of 94.7%. Similarly, the statistical analysis conducted on geographies consisting of 324,225,686 people shows a weak positive correlation between the proportion of Immigrants from Italy and percentage of population with at least 9th grade education in the United States with a correlation coefficient (R) of 0.209 and weighted average of 95.0%, a difference of 0.28%.
9th Grade Correlation Summary
| Measurement | Paraguayan | Immigrants from Italy |
| Minimum | 85.5% | 81.3% |
| Maximum | 100.0% | 100.0% |
| Range | 14.5% | 18.7% |
| Mean | 95.8% | 94.6% |
| Median | 96.7% | 95.0% |
| Interquartile 25% (IQ1) | 93.8% | 92.3% |
| Interquartile 75% (IQ3) | 98.1% | 97.7% |
| Interquartile Range (IQR) | 4.3% | 5.5% |
| Standard Deviation (Sample) | 3.2% | 4.3% |
| Standard Deviation (Population) | 3.2% | 4.2% |
Similar Demographics by 9th Grade
Demographics Similar to Paraguayans by 9th Grade
In terms of 9th grade, the demographic groups most similar to Paraguayans are Immigrants from Northern Africa (94.7%, a difference of 0.010%), Panamanian (94.7%, a difference of 0.010%), Sudanese (94.7%, a difference of 0.020%), Assyrian/Chaldean/Syriac (94.7%, a difference of 0.020%), and Marshallese (94.7%, a difference of 0.020%).
| Demographics | Rating | Rank | 9th Grade |
| Hopi | 37.1 /100 | #186 | Fair 94.8% |
| Guamanians/Chamorros | 35.5 /100 | #187 | Fair 94.8% |
| Immigrants | Albania | 34.5 /100 | #188 | Fair 94.8% |
| Immigrants | Argentina | 34.4 /100 | #189 | Fair 94.8% |
| Sudanese | 32.7 /100 | #190 | Fair 94.7% |
| Assyrians/Chaldeans/Syriacs | 32.0 /100 | #191 | Fair 94.7% |
| Immigrants | Northern Africa | 30.7 /100 | #192 | Fair 94.7% |
| Paraguayans | 30.1 /100 | #193 | Fair 94.7% |
| Panamanians | 29.0 /100 | #194 | Fair 94.7% |
| Marshallese | 27.9 /100 | #195 | Fair 94.7% |
| Immigrants | Lebanon | 27.2 /100 | #196 | Fair 94.7% |
| Immigrants | Micronesia | 24.7 /100 | #197 | Fair 94.7% |
| Hawaiians | 22.7 /100 | #198 | Fair 94.7% |
| Laotians | 21.0 /100 | #199 | Fair 94.6% |
| Immigrants | Zaire | 20.6 /100 | #200 | Fair 94.6% |
Demographics Similar to Immigrants from Italy by 9th Grade
In terms of 9th grade, the demographic groups most similar to Immigrants from Italy are French American Indian (95.0%, a difference of 0.0%), Immigrants from Ukraine (95.0%, a difference of 0.010%), Bermudan (95.0%, a difference of 0.010%), Pakistani (95.0%, a difference of 0.020%), and Venezuelan (95.0%, a difference of 0.020%).
| Demographics | Rating | Rank | 9th Grade |
| Albanians | 76.1 /100 | #153 | Good 95.1% |
| Arabs | 74.9 /100 | #154 | Good 95.1% |
| Immigrants | Kazakhstan | 74.7 /100 | #155 | Good 95.1% |
| Immigrants | Kenya | 73.1 /100 | #156 | Good 95.0% |
| Mongolians | 73.0 /100 | #157 | Good 95.0% |
| Egyptians | 70.1 /100 | #158 | Good 95.0% |
| Immigrants | Ukraine | 67.4 /100 | #159 | Good 95.0% |
| Immigrants | Italy | 66.6 /100 | #160 | Good 95.0% |
| French American Indians | 66.5 /100 | #161 | Good 95.0% |
| Bermudans | 65.8 /100 | #162 | Good 95.0% |
| Pakistanis | 64.1 /100 | #163 | Good 95.0% |
| Venezuelans | 63.6 /100 | #164 | Good 95.0% |
| Blackfeet | 62.6 /100 | #165 | Good 95.0% |
| Ute | 62.6 /100 | #166 | Good 95.0% |
| Immigrants | Brazil | 61.1 /100 | #167 | Good 95.0% |