Paraguayan vs Choctaw In Labor Force | Age 35-44
COMPARE
Paraguayan
Choctaw
In Labor Force | Age 35-44
In Labor Force | Age 35-44 Comparison
Paraguayans
Choctaw
85.4%
IN LABOR FORCE | AGE 35-44
99.9/ 100
METRIC RATING
25th/ 347
METRIC RANK
80.5%
IN LABOR FORCE | AGE 35-44
0.0/ 100
METRIC RATING
324th/ 347
METRIC RANK
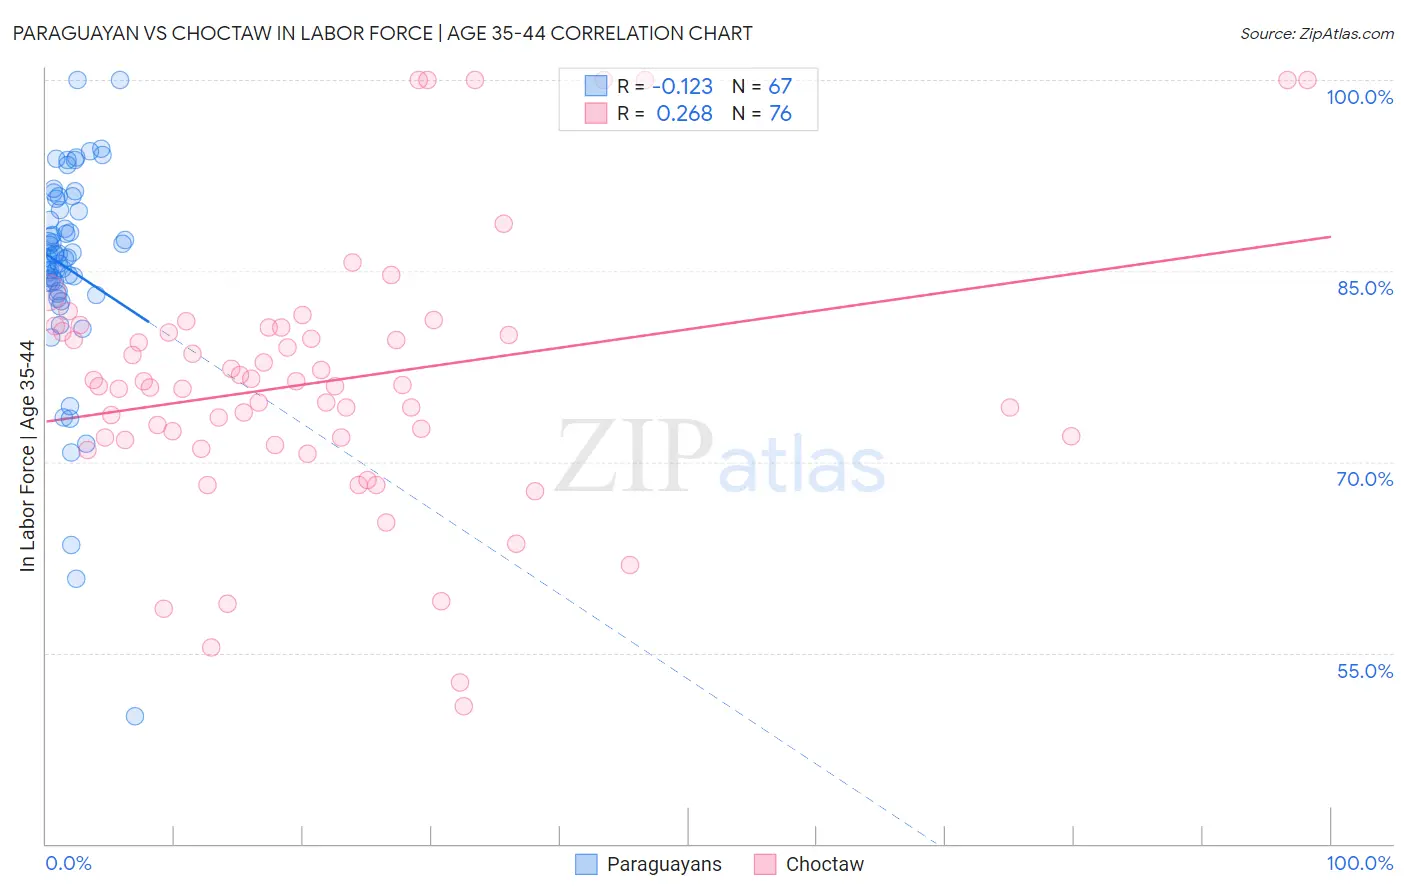
Paraguayan vs Choctaw In Labor Force | Age 35-44 Correlation Chart
The statistical analysis conducted on geographies consisting of 95,103,521 people shows a poor negative correlation between the proportion of Paraguayans and labor force participation rate among population between the ages 35 and 44 in the United States with a correlation coefficient (R) of -0.123 and weighted average of 85.4%. Similarly, the statistical analysis conducted on geographies consisting of 269,650,989 people shows a weak positive correlation between the proportion of Choctaw and labor force participation rate among population between the ages 35 and 44 in the United States with a correlation coefficient (R) of 0.268 and weighted average of 80.5%, a difference of 6.0%.
In Labor Force | Age 35-44 Correlation Summary
| Measurement | Paraguayan | Choctaw |
| Minimum | 50.0% | 50.8% |
| Maximum | 100.0% | 100.0% |
| Range | 50.0% | 49.2% |
| Mean | 85.2% | 76.4% |
| Median | 86.2% | 76.0% |
| Interquartile 25% (IQ1) | 83.4% | 71.8% |
| Interquartile 75% (IQ3) | 89.8% | 80.4% |
| Interquartile Range (IQR) | 6.4% | 8.5% |
| Standard Deviation (Sample) | 8.3% | 10.5% |
| Standard Deviation (Population) | 8.3% | 10.4% |
Similar Demographics by In Labor Force | Age 35-44
Demographics Similar to Paraguayans by In Labor Force | Age 35-44
In terms of in labor force | age 35-44, the demographic groups most similar to Paraguayans are Immigrants from Liberia (85.4%, a difference of 0.0%), Immigrants from Lithuania (85.4%, a difference of 0.0%), Latvian (85.4%, a difference of 0.010%), Immigrants from Greece (85.3%, a difference of 0.020%), and Cambodian (85.3%, a difference of 0.060%).
| Demographics | Rating | Rank | In Labor Force | Age 35-44 |
| Carpatho Rusyns | 100.0 /100 | #18 | Exceptional 85.6% |
| Slovenes | 100.0 /100 | #19 | Exceptional 85.6% |
| Immigrants | Serbia | 100.0 /100 | #20 | Exceptional 85.5% |
| Bulgarians | 100.0 /100 | #21 | Exceptional 85.5% |
| Immigrants | Bosnia and Herzegovina | 100.0 /100 | #22 | Exceptional 85.4% |
| Immigrants | Eastern Africa | 100.0 /100 | #23 | Exceptional 85.4% |
| Latvians | 99.9 /100 | #24 | Exceptional 85.4% |
| Paraguayans | 99.9 /100 | #25 | Exceptional 85.4% |
| Immigrants | Liberia | 99.9 /100 | #26 | Exceptional 85.4% |
| Immigrants | Lithuania | 99.9 /100 | #27 | Exceptional 85.4% |
| Immigrants | Greece | 99.9 /100 | #28 | Exceptional 85.3% |
| Cambodians | 99.9 /100 | #29 | Exceptional 85.3% |
| Bermudans | 99.9 /100 | #30 | Exceptional 85.3% |
| Czechs | 99.9 /100 | #31 | Exceptional 85.3% |
| Immigrants | India | 99.9 /100 | #32 | Exceptional 85.3% |
Demographics Similar to Choctaw by In Labor Force | Age 35-44
In terms of in labor force | age 35-44, the demographic groups most similar to Choctaw are Yaqui (80.5%, a difference of 0.010%), Paiute (80.6%, a difference of 0.13%), Dutch West Indian (80.4%, a difference of 0.15%), Puerto Rican (80.7%, a difference of 0.19%), and Seminole (80.4%, a difference of 0.19%).
| Demographics | Rating | Rank | In Labor Force | Age 35-44 |
| Cherokee | 0.0 /100 | #317 | Tragic 81.4% |
| Alaskan Athabascans | 0.0 /100 | #318 | Tragic 81.3% |
| Inupiat | 0.0 /100 | #319 | Tragic 80.9% |
| Chickasaw | 0.0 /100 | #320 | Tragic 80.9% |
| Puerto Ricans | 0.0 /100 | #321 | Tragic 80.7% |
| Paiute | 0.0 /100 | #322 | Tragic 80.6% |
| Yaqui | 0.0 /100 | #323 | Tragic 80.5% |
| Choctaw | 0.0 /100 | #324 | Tragic 80.5% |
| Dutch West Indians | 0.0 /100 | #325 | Tragic 80.4% |
| Seminole | 0.0 /100 | #326 | Tragic 80.4% |
| Sioux | 0.0 /100 | #327 | Tragic 80.2% |
| Creek | 0.0 /100 | #328 | Tragic 80.0% |
| Menominee | 0.0 /100 | #329 | Tragic 79.7% |
| Cheyenne | 0.0 /100 | #330 | Tragic 79.5% |
| Houma | 0.0 /100 | #331 | Tragic 79.5% |