German vs Choctaw In Labor Force | Age 35-44
COMPARE
German
Choctaw
In Labor Force | Age 35-44
In Labor Force | Age 35-44 Comparison
Germans
Choctaw
84.7%
IN LABOR FORCE | AGE 35-44
91.0/ 100
METRIC RATING
122nd/ 347
METRIC RANK
80.5%
IN LABOR FORCE | AGE 35-44
0.0/ 100
METRIC RATING
324th/ 347
METRIC RANK
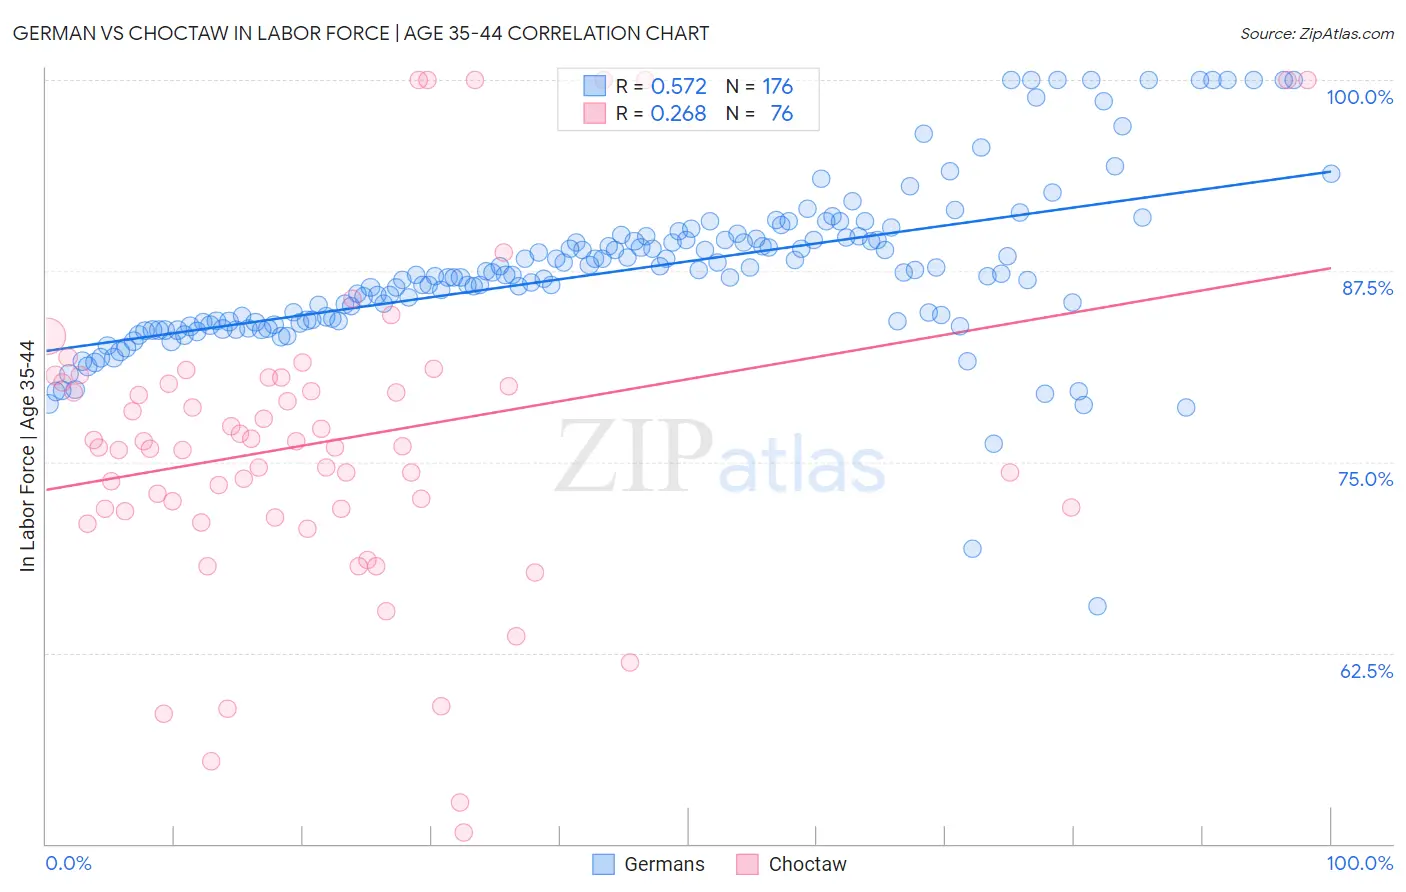
German vs Choctaw In Labor Force | Age 35-44 Correlation Chart
The statistical analysis conducted on geographies consisting of 580,230,467 people shows a substantial positive correlation between the proportion of Germans and labor force participation rate among population between the ages 35 and 44 in the United States with a correlation coefficient (R) of 0.572 and weighted average of 84.7%. Similarly, the statistical analysis conducted on geographies consisting of 269,650,989 people shows a weak positive correlation between the proportion of Choctaw and labor force participation rate among population between the ages 35 and 44 in the United States with a correlation coefficient (R) of 0.268 and weighted average of 80.5%, a difference of 5.2%.
In Labor Force | Age 35-44 Correlation Summary
| Measurement | German | Choctaw |
| Minimum | 65.5% | 50.8% |
| Maximum | 100.0% | 100.0% |
| Range | 34.5% | 49.2% |
| Mean | 87.5% | 76.4% |
| Median | 87.2% | 76.0% |
| Interquartile 25% (IQ1) | 84.1% | 71.8% |
| Interquartile 75% (IQ3) | 89.6% | 80.4% |
| Interquartile Range (IQR) | 5.5% | 8.5% |
| Standard Deviation (Sample) | 5.4% | 10.5% |
| Standard Deviation (Population) | 5.4% | 10.4% |
Similar Demographics by In Labor Force | Age 35-44
Demographics Similar to Germans by In Labor Force | Age 35-44
In terms of in labor force | age 35-44, the demographic groups most similar to Germans are Finnish (84.7%, a difference of 0.0%), Immigrants from South America (84.7%, a difference of 0.0%), Slavic (84.7%, a difference of 0.0%), Burmese (84.7%, a difference of 0.010%), and Immigrants from Northern Europe (84.7%, a difference of 0.010%).
| Demographics | Rating | Rank | In Labor Force | Age 35-44 |
| Bahamians | 93.2 /100 | #115 | Exceptional 84.7% |
| Immigrants | Egypt | 92.7 /100 | #116 | Exceptional 84.7% |
| Immigrants | China | 92.3 /100 | #117 | Exceptional 84.7% |
| Immigrants | Eastern Asia | 92.1 /100 | #118 | Exceptional 84.7% |
| Burmese | 91.8 /100 | #119 | Exceptional 84.7% |
| Immigrants | Northern Europe | 91.5 /100 | #120 | Exceptional 84.7% |
| Finns | 91.2 /100 | #121 | Exceptional 84.7% |
| Germans | 91.0 /100 | #122 | Exceptional 84.7% |
| Immigrants | South America | 90.9 /100 | #123 | Exceptional 84.7% |
| Slavs | 90.8 /100 | #124 | Exceptional 84.7% |
| Maltese | 90.8 /100 | #125 | Exceptional 84.7% |
| Asians | 90.6 /100 | #126 | Exceptional 84.7% |
| Immigrants | Spain | 90.6 /100 | #127 | Exceptional 84.7% |
| Immigrants | Ghana | 90.4 /100 | #128 | Exceptional 84.7% |
| Palestinians | 89.7 /100 | #129 | Excellent 84.7% |
Demographics Similar to Choctaw by In Labor Force | Age 35-44
In terms of in labor force | age 35-44, the demographic groups most similar to Choctaw are Yaqui (80.5%, a difference of 0.010%), Paiute (80.6%, a difference of 0.13%), Dutch West Indian (80.4%, a difference of 0.15%), Puerto Rican (80.7%, a difference of 0.19%), and Seminole (80.4%, a difference of 0.19%).
| Demographics | Rating | Rank | In Labor Force | Age 35-44 |
| Cherokee | 0.0 /100 | #317 | Tragic 81.4% |
| Alaskan Athabascans | 0.0 /100 | #318 | Tragic 81.3% |
| Inupiat | 0.0 /100 | #319 | Tragic 80.9% |
| Chickasaw | 0.0 /100 | #320 | Tragic 80.9% |
| Puerto Ricans | 0.0 /100 | #321 | Tragic 80.7% |
| Paiute | 0.0 /100 | #322 | Tragic 80.6% |
| Yaqui | 0.0 /100 | #323 | Tragic 80.5% |
| Choctaw | 0.0 /100 | #324 | Tragic 80.5% |
| Dutch West Indians | 0.0 /100 | #325 | Tragic 80.4% |
| Seminole | 0.0 /100 | #326 | Tragic 80.4% |
| Sioux | 0.0 /100 | #327 | Tragic 80.2% |
| Creek | 0.0 /100 | #328 | Tragic 80.0% |
| Menominee | 0.0 /100 | #329 | Tragic 79.7% |
| Cheyenne | 0.0 /100 | #330 | Tragic 79.5% |
| Houma | 0.0 /100 | #331 | Tragic 79.5% |