Panamanian vs Spaniard In Labor Force | Age 30-34
COMPARE
Panamanian
Spaniard
In Labor Force | Age 30-34
In Labor Force | Age 30-34 Comparison
Panamanians
Spaniards
84.2%
IN LABOR FORCE | AGE 30-34
3.8/ 100
METRIC RATING
222nd/ 347
METRIC RANK
83.6%
IN LABOR FORCE | AGE 30-34
0.1/ 100
METRIC RATING
267th/ 347
METRIC RANK
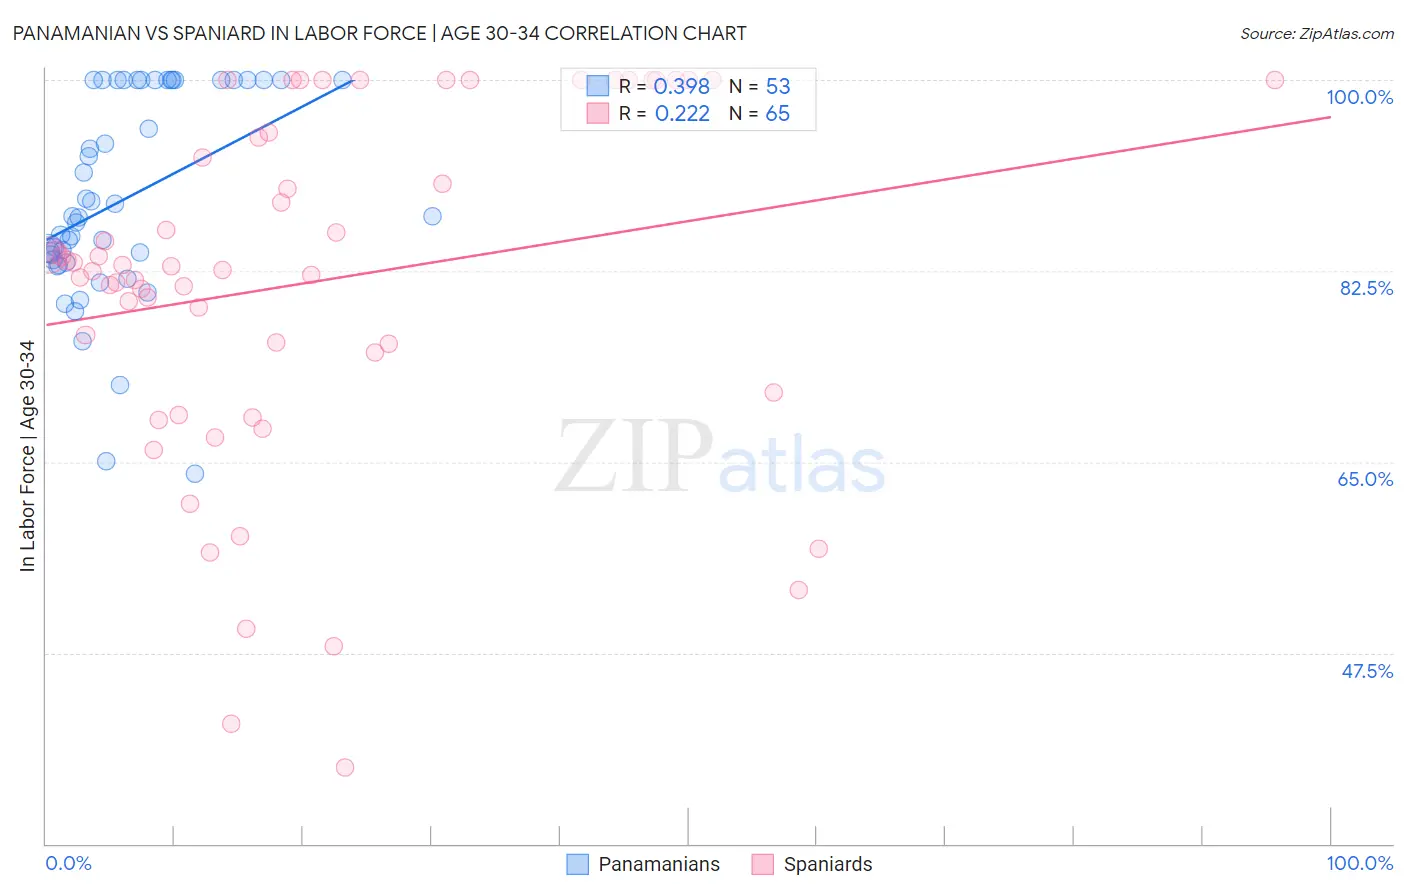
Panamanian vs Spaniard In Labor Force | Age 30-34 Correlation Chart
The statistical analysis conducted on geographies consisting of 281,117,807 people shows a mild positive correlation between the proportion of Panamanians and labor force participation rate among population between the ages 30 and 34 in the United States with a correlation coefficient (R) of 0.398 and weighted average of 84.2%. Similarly, the statistical analysis conducted on geographies consisting of 443,126,023 people shows a weak positive correlation between the proportion of Spaniards and labor force participation rate among population between the ages 30 and 34 in the United States with a correlation coefficient (R) of 0.222 and weighted average of 83.6%, a difference of 0.71%.
In Labor Force | Age 30-34 Correlation Summary
| Measurement | Panamanian | Spaniard |
| Minimum | 63.9% | 36.9% |
| Maximum | 100.0% | 100.0% |
| Range | 36.1% | 63.1% |
| Mean | 89.1% | 81.5% |
| Median | 87.5% | 82.9% |
| Interquartile 25% (IQ1) | 83.4% | 73.2% |
| Interquartile 75% (IQ3) | 100.0% | 97.6% |
| Interquartile Range (IQR) | 16.6% | 24.4% |
| Standard Deviation (Sample) | 9.4% | 16.0% |
| Standard Deviation (Population) | 9.3% | 15.8% |
Similar Demographics by In Labor Force | Age 30-34
Demographics Similar to Panamanians by In Labor Force | Age 30-34
In terms of in labor force | age 30-34, the demographic groups most similar to Panamanians are Salvadoran (84.2%, a difference of 0.0%), Immigrants from Laos (84.2%, a difference of 0.010%), Cuban (84.2%, a difference of 0.020%), Scottish (84.2%, a difference of 0.040%), and Immigrants from El Salvador (84.2%, a difference of 0.040%).
| Demographics | Rating | Rank | In Labor Force | Age 30-34 |
| Europeans | 7.2 /100 | #215 | Tragic 84.3% |
| Immigrants | Ecuador | 7.1 /100 | #216 | Tragic 84.3% |
| Immigrants | Trinidad and Tobago | 7.0 /100 | #217 | Tragic 84.3% |
| Immigrants | Panama | 6.3 /100 | #218 | Tragic 84.3% |
| Swiss | 5.8 /100 | #219 | Tragic 84.3% |
| Danes | 5.3 /100 | #220 | Tragic 84.3% |
| Salvadorans | 3.8 /100 | #221 | Tragic 84.2% |
| Panamanians | 3.8 /100 | #222 | Tragic 84.2% |
| Immigrants | Laos | 3.6 /100 | #223 | Tragic 84.2% |
| Cubans | 3.4 /100 | #224 | Tragic 84.2% |
| Scottish | 3.1 /100 | #225 | Tragic 84.2% |
| Immigrants | El Salvador | 3.0 /100 | #226 | Tragic 84.2% |
| Immigrants | Cuba | 3.0 /100 | #227 | Tragic 84.2% |
| Immigrants | Haiti | 2.8 /100 | #228 | Tragic 84.2% |
| Welsh | 2.7 /100 | #229 | Tragic 84.2% |
Demographics Similar to Spaniards by In Labor Force | Age 30-34
In terms of in labor force | age 30-34, the demographic groups most similar to Spaniards are Immigrants from Bangladesh (83.6%, a difference of 0.010%), Vietnamese (83.6%, a difference of 0.020%), Spanish American (83.5%, a difference of 0.070%), Spanish (83.5%, a difference of 0.090%), and Nonimmigrants (83.5%, a difference of 0.090%).
| Demographics | Rating | Rank | In Labor Force | Age 30-34 |
| Immigrants | Dominican Republic | 0.3 /100 | #260 | Tragic 83.8% |
| Guyanese | 0.3 /100 | #261 | Tragic 83.8% |
| Dominicans | 0.2 /100 | #262 | Tragic 83.8% |
| Immigrants | Guyana | 0.2 /100 | #263 | Tragic 83.8% |
| Guatemalans | 0.2 /100 | #264 | Tragic 83.7% |
| Immigrants | Honduras | 0.1 /100 | #265 | Tragic 83.7% |
| Immigrants | Guatemala | 0.1 /100 | #266 | Tragic 83.7% |
| Spaniards | 0.1 /100 | #267 | Tragic 83.6% |
| Immigrants | Bangladesh | 0.1 /100 | #268 | Tragic 83.6% |
| Vietnamese | 0.1 /100 | #269 | Tragic 83.6% |
| Spanish Americans | 0.0 /100 | #270 | Tragic 83.5% |
| Spanish | 0.0 /100 | #271 | Tragic 83.5% |
| Immigrants | Nonimmigrants | 0.0 /100 | #272 | Tragic 83.5% |
| Guamanians/Chamorros | 0.0 /100 | #273 | Tragic 83.5% |
| Belizeans | 0.0 /100 | #274 | Tragic 83.5% |