Panamanian vs Spaniard In Labor Force | Age 35-44
COMPARE
Panamanian
Spaniard
In Labor Force | Age 35-44
In Labor Force | Age 35-44 Comparison
Panamanians
Spaniards
84.0%
IN LABOR FORCE | AGE 35-44
5.4/ 100
METRIC RATING
226th/ 347
METRIC RANK
83.4%
IN LABOR FORCE | AGE 35-44
0.1/ 100
METRIC RATING
266th/ 347
METRIC RANK
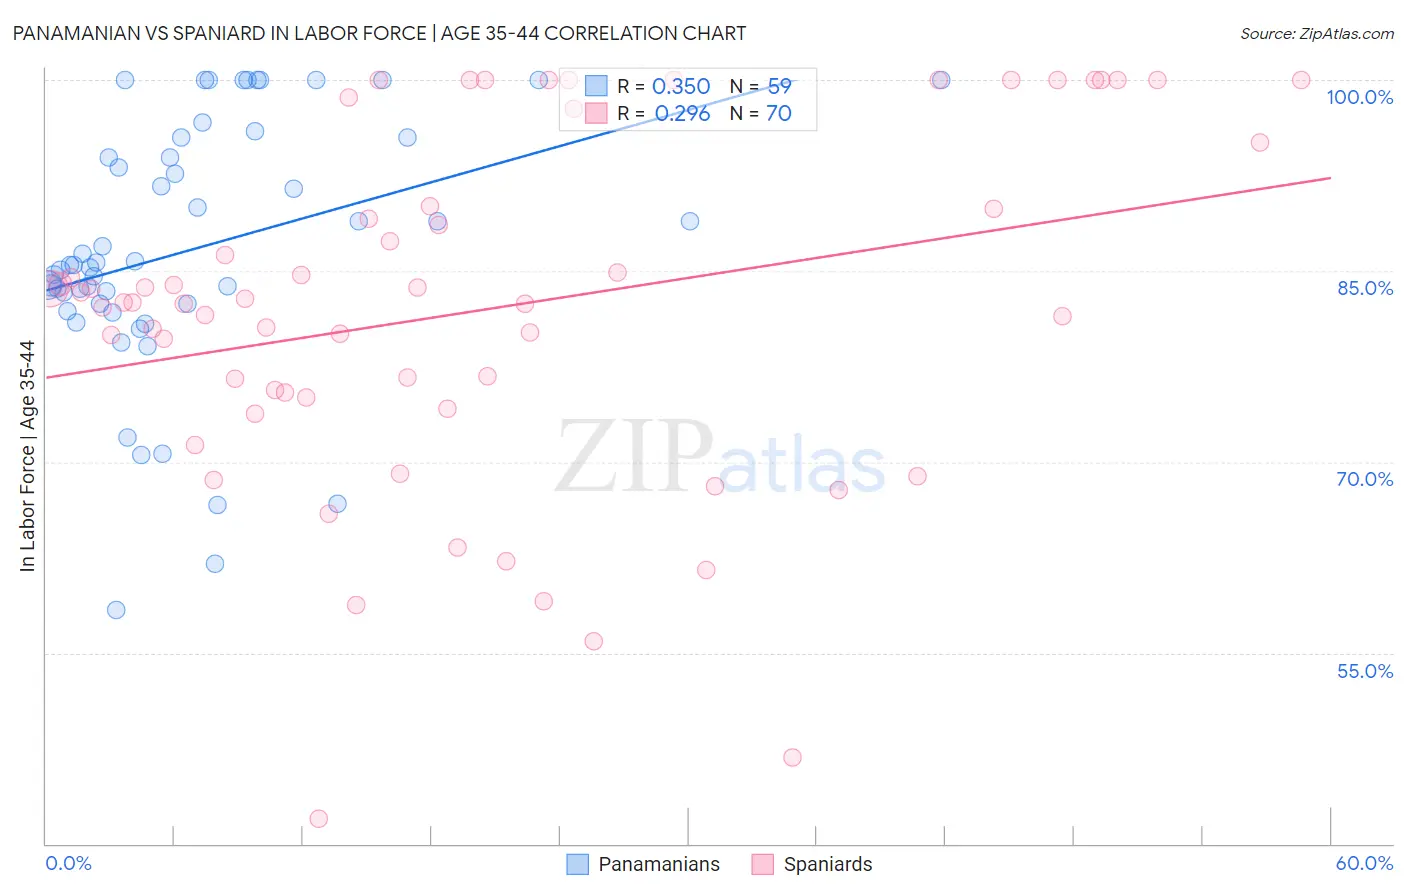
Panamanian vs Spaniard In Labor Force | Age 35-44 Correlation Chart
The statistical analysis conducted on geographies consisting of 281,116,157 people shows a mild positive correlation between the proportion of Panamanians and labor force participation rate among population between the ages 35 and 44 in the United States with a correlation coefficient (R) of 0.350 and weighted average of 84.0%. Similarly, the statistical analysis conducted on geographies consisting of 443,255,372 people shows a weak positive correlation between the proportion of Spaniards and labor force participation rate among population between the ages 35 and 44 in the United States with a correlation coefficient (R) of 0.296 and weighted average of 83.4%, a difference of 0.66%.
In Labor Force | Age 35-44 Correlation Summary
| Measurement | Panamanian | Spaniard |
| Minimum | 58.4% | 41.9% |
| Maximum | 100.0% | 100.0% |
| Range | 41.6% | 58.1% |
| Mean | 86.7% | 81.9% |
| Median | 85.5% | 82.5% |
| Interquartile 25% (IQ1) | 82.4% | 75.0% |
| Interquartile 75% (IQ3) | 95.5% | 90.1% |
| Interquartile Range (IQR) | 13.1% | 15.1% |
| Standard Deviation (Sample) | 10.1% | 13.7% |
| Standard Deviation (Population) | 10.0% | 13.6% |
Similar Demographics by In Labor Force | Age 35-44
Demographics Similar to Panamanians by In Labor Force | Age 35-44
In terms of in labor force | age 35-44, the demographic groups most similar to Panamanians are British West Indian (84.0%, a difference of 0.0%), Welsh (84.0%, a difference of 0.0%), U.S. Virgin Islander (84.0%, a difference of 0.020%), Immigrants from Burma/Myanmar (84.0%, a difference of 0.020%), and Assyrian/Chaldean/Syriac (84.0%, a difference of 0.030%).
| Demographics | Rating | Rank | In Labor Force | Age 35-44 |
| Sub-Saharan Africans | 9.3 /100 | #219 | Tragic 84.1% |
| French | 7.5 /100 | #220 | Tragic 84.0% |
| Icelanders | 6.7 /100 | #221 | Tragic 84.0% |
| Assyrians/Chaldeans/Syriacs | 6.6 /100 | #222 | Tragic 84.0% |
| Immigrants | Panama | 6.4 /100 | #223 | Tragic 84.0% |
| U.S. Virgin Islanders | 6.1 /100 | #224 | Tragic 84.0% |
| Immigrants | Burma/Myanmar | 6.1 /100 | #225 | Tragic 84.0% |
| Panamanians | 5.4 /100 | #226 | Tragic 84.0% |
| British West Indians | 5.3 /100 | #227 | Tragic 84.0% |
| Welsh | 5.3 /100 | #228 | Tragic 84.0% |
| Immigrants | Thailand | 4.7 /100 | #229 | Tragic 84.0% |
| Immigrants | Iraq | 3.7 /100 | #230 | Tragic 83.9% |
| Scottish | 3.2 /100 | #231 | Tragic 83.9% |
| Native Hawaiians | 3.0 /100 | #232 | Tragic 83.9% |
| Immigrants | Germany | 2.8 /100 | #233 | Tragic 83.9% |
Demographics Similar to Spaniards by In Labor Force | Age 35-44
In terms of in labor force | age 35-44, the demographic groups most similar to Spaniards are Scotch-Irish (83.5%, a difference of 0.040%), Central American (83.5%, a difference of 0.040%), Guamanian/Chamorro (83.4%, a difference of 0.050%), Iroquois (83.5%, a difference of 0.070%), and Honduran (83.4%, a difference of 0.080%).
| Demographics | Rating | Rank | In Labor Force | Age 35-44 |
| Immigrants | El Salvador | 0.2 /100 | #259 | Tragic 83.5% |
| Vietnamese | 0.2 /100 | #260 | Tragic 83.5% |
| Immigrants | Dominica | 0.2 /100 | #261 | Tragic 83.5% |
| Immigrants | Congo | 0.2 /100 | #262 | Tragic 83.5% |
| Iroquois | 0.2 /100 | #263 | Tragic 83.5% |
| Scotch-Irish | 0.1 /100 | #264 | Tragic 83.5% |
| Central Americans | 0.1 /100 | #265 | Tragic 83.5% |
| Spaniards | 0.1 /100 | #266 | Tragic 83.4% |
| Guamanians/Chamorros | 0.1 /100 | #267 | Tragic 83.4% |
| Hondurans | 0.1 /100 | #268 | Tragic 83.4% |
| Immigrants | Grenada | 0.1 /100 | #269 | Tragic 83.3% |
| Immigrants | Honduras | 0.0 /100 | #270 | Tragic 83.3% |
| French American Indians | 0.0 /100 | #271 | Tragic 83.2% |
| Immigrants | Fiji | 0.0 /100 | #272 | Tragic 83.2% |
| Spanish | 0.0 /100 | #273 | Tragic 83.2% |