Palestinian vs Japanese In Labor Force | Age 30-34
COMPARE
Palestinian
Japanese
In Labor Force | Age 30-34
In Labor Force | Age 30-34 Comparison
Palestinians
Japanese
84.9%
IN LABOR FORCE | AGE 30-34
77.7/ 100
METRIC RATING
145th/ 347
METRIC RANK
84.3%
IN LABOR FORCE | AGE 30-34
8.8/ 100
METRIC RATING
211th/ 347
METRIC RANK
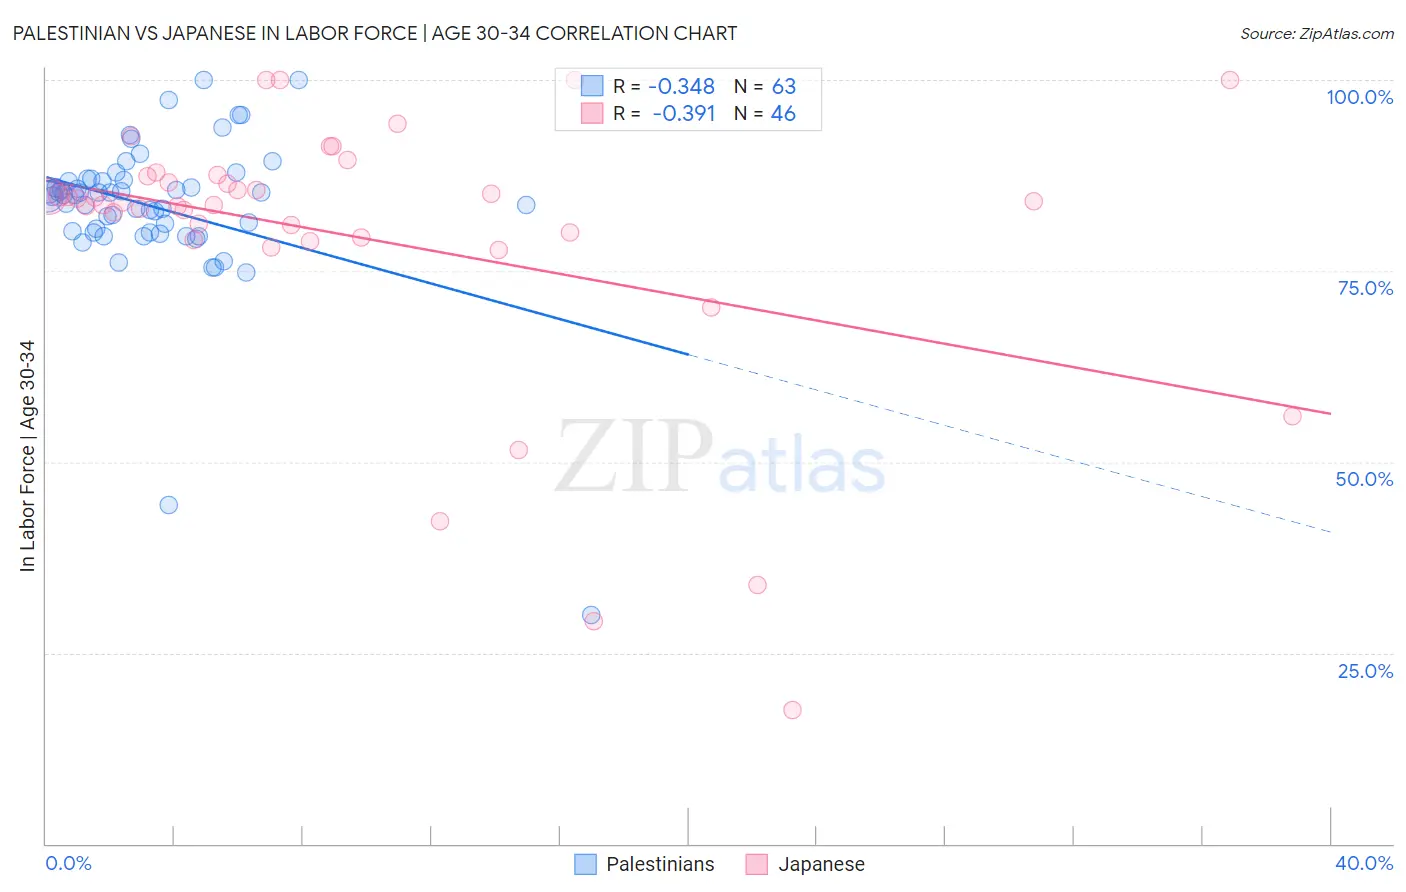
Palestinian vs Japanese In Labor Force | Age 30-34 Correlation Chart
The statistical analysis conducted on geographies consisting of 216,407,612 people shows a mild negative correlation between the proportion of Palestinians and labor force participation rate among population between the ages 30 and 34 in the United States with a correlation coefficient (R) of -0.348 and weighted average of 84.9%. Similarly, the statistical analysis conducted on geographies consisting of 249,105,217 people shows a mild negative correlation between the proportion of Japanese and labor force participation rate among population between the ages 30 and 34 in the United States with a correlation coefficient (R) of -0.391 and weighted average of 84.3%, a difference of 0.63%.
In Labor Force | Age 30-34 Correlation Summary
| Measurement | Palestinian | Japanese |
| Minimum | 30.0% | 17.5% |
| Maximum | 100.0% | 100.0% |
| Range | 70.0% | 82.5% |
| Mean | 83.4% | 79.6% |
| Median | 84.9% | 84.0% |
| Interquartile 25% (IQ1) | 80.1% | 79.4% |
| Interquartile 75% (IQ3) | 86.9% | 87.3% |
| Interquartile Range (IQR) | 6.8% | 8.0% |
| Standard Deviation (Sample) | 10.2% | 17.9% |
| Standard Deviation (Population) | 10.1% | 17.7% |
Similar Demographics by In Labor Force | Age 30-34
Demographics Similar to Palestinians by In Labor Force | Age 30-34
In terms of in labor force | age 30-34, the demographic groups most similar to Palestinians are Uruguayan (84.9%, a difference of 0.010%), Immigrants from Saudi Arabia (84.9%, a difference of 0.010%), Immigrants from Colombia (84.9%, a difference of 0.010%), Immigrants from Pakistan (84.9%, a difference of 0.010%), and Immigrants from Ukraine (84.8%, a difference of 0.020%).
| Demographics | Rating | Rank | In Labor Force | Age 30-34 |
| Sri Lankans | 87.8 /100 | #138 | Excellent 85.0% |
| Bhutanese | 87.5 /100 | #139 | Excellent 85.0% |
| Immigrants | Vietnam | 86.5 /100 | #140 | Excellent 85.0% |
| Chileans | 85.3 /100 | #141 | Excellent 84.9% |
| Immigrants | Indonesia | 84.3 /100 | #142 | Excellent 84.9% |
| Colombians | 82.2 /100 | #143 | Excellent 84.9% |
| Uruguayans | 78.5 /100 | #144 | Good 84.9% |
| Palestinians | 77.7 /100 | #145 | Good 84.9% |
| Immigrants | Saudi Arabia | 76.6 /100 | #146 | Good 84.9% |
| Immigrants | Colombia | 76.3 /100 | #147 | Good 84.9% |
| Immigrants | Pakistan | 76.2 /100 | #148 | Good 84.9% |
| Immigrants | Ukraine | 75.1 /100 | #149 | Good 84.8% |
| Germans | 75.1 /100 | #150 | Good 84.8% |
| Immigrants | Senegal | 74.0 /100 | #151 | Good 84.8% |
| Romanians | 73.5 /100 | #152 | Good 84.8% |
Demographics Similar to Japanese by In Labor Force | Age 30-34
In terms of in labor force | age 30-34, the demographic groups most similar to Japanese are Arab (84.3%, a difference of 0.0%), Jamaican (84.3%, a difference of 0.0%), Indonesian (84.3%, a difference of 0.0%), Bangladeshi (84.3%, a difference of 0.010%), and Immigrants from Western Asia (84.3%, a difference of 0.010%).
| Demographics | Rating | Rank | In Labor Force | Age 30-34 |
| Ecuadorians | 14.2 /100 | #204 | Poor 84.4% |
| French | 13.8 /100 | #205 | Poor 84.4% |
| Lebanese | 10.6 /100 | #206 | Poor 84.4% |
| Bangladeshis | 9.4 /100 | #207 | Tragic 84.3% |
| Arabs | 8.9 /100 | #208 | Tragic 84.3% |
| Jamaicans | 8.8 /100 | #209 | Tragic 84.3% |
| Indonesians | 8.8 /100 | #210 | Tragic 84.3% |
| Japanese | 8.8 /100 | #211 | Tragic 84.3% |
| Immigrants | Western Asia | 8.2 /100 | #212 | Tragic 84.3% |
| Immigrants | Jamaica | 7.9 /100 | #213 | Tragic 84.3% |
| Immigrants | Germany | 7.2 /100 | #214 | Tragic 84.3% |
| Europeans | 7.2 /100 | #215 | Tragic 84.3% |
| Immigrants | Ecuador | 7.1 /100 | #216 | Tragic 84.3% |
| Immigrants | Trinidad and Tobago | 7.0 /100 | #217 | Tragic 84.3% |
| Immigrants | Panama | 6.3 /100 | #218 | Tragic 84.3% |