Palestinian vs Scotch-Irish In Labor Force | Age 20-24
COMPARE
Palestinian
Scotch-Irish
In Labor Force | Age 20-24
In Labor Force | Age 20-24 Comparison
Palestinians
Scotch-Irish
75.6%
IN LABOR FORCE | AGE 20-24
88.4/ 100
METRIC RATING
132nd/ 347
METRIC RANK
77.0%
IN LABOR FORCE | AGE 20-24
99.9/ 100
METRIC RATING
59th/ 347
METRIC RANK
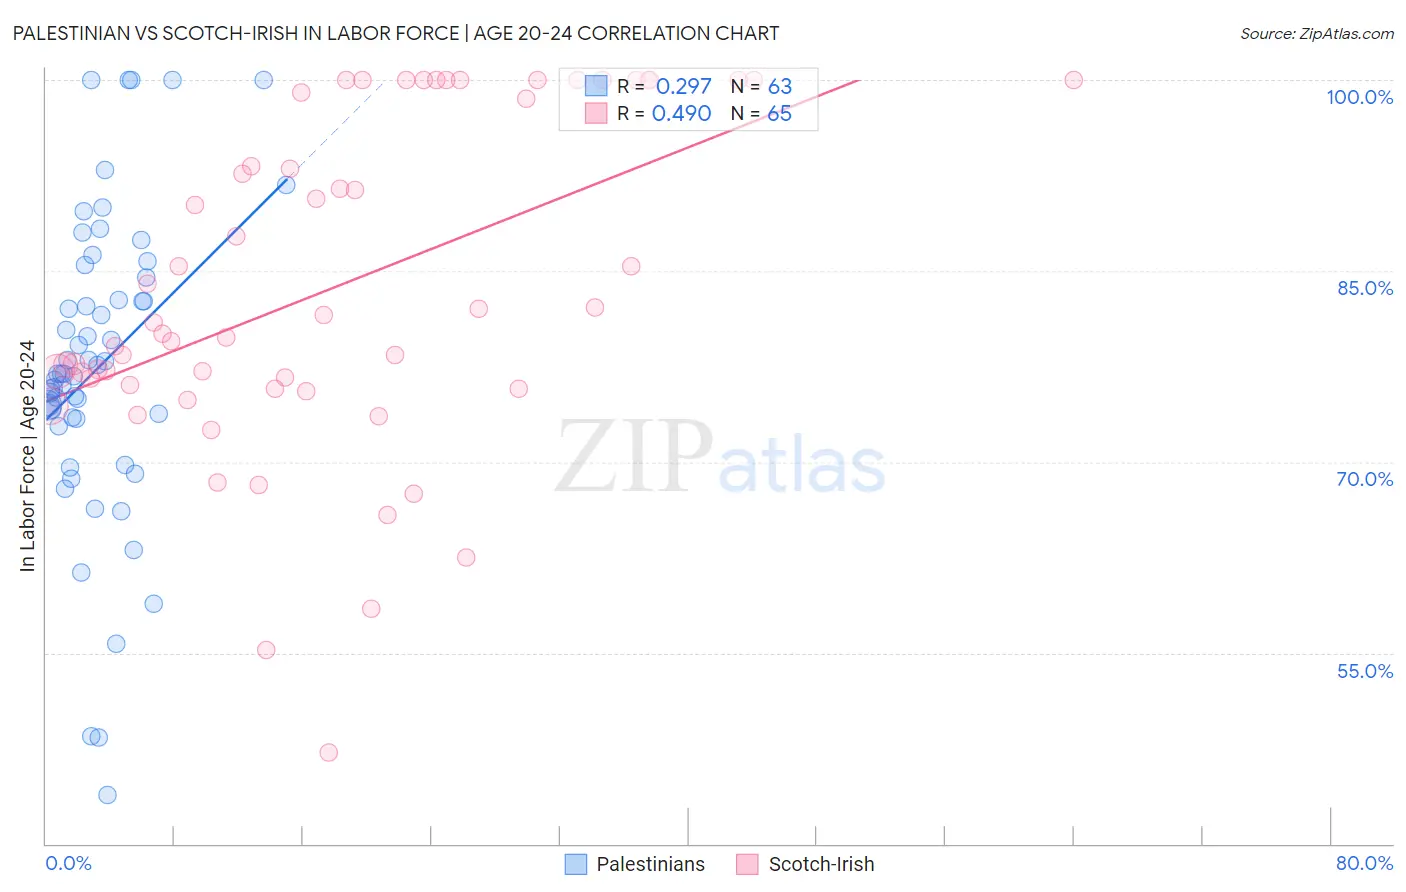
Palestinian vs Scotch-Irish In Labor Force | Age 20-24 Correlation Chart
The statistical analysis conducted on geographies consisting of 216,454,199 people shows a weak positive correlation between the proportion of Palestinians and labor force participation rate among population between the ages 20 and 24 in the United States with a correlation coefficient (R) of 0.297 and weighted average of 75.6%. Similarly, the statistical analysis conducted on geographies consisting of 547,632,235 people shows a moderate positive correlation between the proportion of Scotch-Irish and labor force participation rate among population between the ages 20 and 24 in the United States with a correlation coefficient (R) of 0.490 and weighted average of 77.0%, a difference of 1.9%.
In Labor Force | Age 20-24 Correlation Summary
| Measurement | Palestinian | Scotch-Irish |
| Minimum | 43.8% | 47.2% |
| Maximum | 100.0% | 100.0% |
| Range | 56.2% | 52.8% |
| Mean | 77.5% | 83.8% |
| Median | 76.9% | 81.0% |
| Interquartile 25% (IQ1) | 73.4% | 75.9% |
| Interquartile 75% (IQ3) | 84.5% | 99.5% |
| Interquartile Range (IQR) | 11.1% | 23.6% |
| Standard Deviation (Sample) | 12.0% | 13.0% |
| Standard Deviation (Population) | 11.9% | 12.9% |
Similar Demographics by In Labor Force | Age 20-24
Demographics Similar to Palestinians by In Labor Force | Age 20-24
In terms of in labor force | age 20-24, the demographic groups most similar to Palestinians are Immigrants from Jordan (75.6%, a difference of 0.0%), Immigrants from Austria (75.6%, a difference of 0.010%), Zimbabwean (75.6%, a difference of 0.010%), Iroquois (75.6%, a difference of 0.020%), and Immigrants from Afghanistan (75.6%, a difference of 0.040%).
| Demographics | Rating | Rank | In Labor Force | Age 20-24 |
| Immigrants | Scotland | 93.7 /100 | #125 | Exceptional 75.8% |
| Brazilians | 93.0 /100 | #126 | Exceptional 75.8% |
| Sub-Saharan Africans | 90.9 /100 | #127 | Exceptional 75.7% |
| Immigrants | Afghanistan | 89.4 /100 | #128 | Excellent 75.6% |
| Iroquois | 89.1 /100 | #129 | Excellent 75.6% |
| Immigrants | Austria | 88.8 /100 | #130 | Excellent 75.6% |
| Immigrants | Jordan | 88.5 /100 | #131 | Excellent 75.6% |
| Palestinians | 88.4 /100 | #132 | Excellent 75.6% |
| Zimbabweans | 88.2 /100 | #133 | Excellent 75.6% |
| Estonians | 87.1 /100 | #134 | Excellent 75.6% |
| Yaqui | 85.5 /100 | #135 | Excellent 75.5% |
| Immigrants | Brazil | 84.8 /100 | #136 | Excellent 75.5% |
| Jordanians | 84.8 /100 | #137 | Excellent 75.5% |
| Australians | 84.8 /100 | #138 | Excellent 75.5% |
| Immigrants | England | 84.6 /100 | #139 | Excellent 75.5% |
Demographics Similar to Scotch-Irish by In Labor Force | Age 20-24
In terms of in labor force | age 20-24, the demographic groups most similar to Scotch-Irish are Hawaiian (77.0%, a difference of 0.030%), Kenyan (77.0%, a difference of 0.040%), Chippewa (77.1%, a difference of 0.050%), European (77.1%, a difference of 0.060%), and Immigrants from Liberia (77.1%, a difference of 0.070%).
| Demographics | Rating | Rank | In Labor Force | Age 20-24 |
| Indonesians | 100.0 /100 | #52 | Exceptional 77.2% |
| Immigrants | Azores | 100.0 /100 | #53 | Exceptional 77.2% |
| Celtics | 99.9 /100 | #54 | Exceptional 77.1% |
| Immigrants | Liberia | 99.9 /100 | #55 | Exceptional 77.1% |
| Europeans | 99.9 /100 | #56 | Exceptional 77.1% |
| Chippewa | 99.9 /100 | #57 | Exceptional 77.1% |
| Hawaiians | 99.9 /100 | #58 | Exceptional 77.0% |
| Scotch-Irish | 99.9 /100 | #59 | Exceptional 77.0% |
| Kenyans | 99.9 /100 | #60 | Exceptional 77.0% |
| Immigrants | Eritrea | 99.9 /100 | #61 | Exceptional 77.0% |
| Immigrants | Kenya | 99.9 /100 | #62 | Exceptional 77.0% |
| Lithuanians | 99.9 /100 | #63 | Exceptional 77.0% |
| Whites/Caucasians | 99.9 /100 | #64 | Exceptional 76.9% |
| Crow | 99.9 /100 | #65 | Exceptional 76.9% |
| Icelanders | 99.9 /100 | #66 | Exceptional 76.9% |