Palestinian vs Immigrants from Barbados In Labor Force | Age 25-29
COMPARE
Palestinian
Immigrants from Barbados
In Labor Force | Age 25-29
In Labor Force | Age 25-29 Comparison
Palestinians
Immigrants from Barbados
84.7%
IN LABOR FORCE | AGE 25-29
50.0/ 100
METRIC RATING
174th/ 347
METRIC RANK
83.4%
IN LABOR FORCE | AGE 25-29
0.0/ 100
METRIC RATING
269th/ 347
METRIC RANK
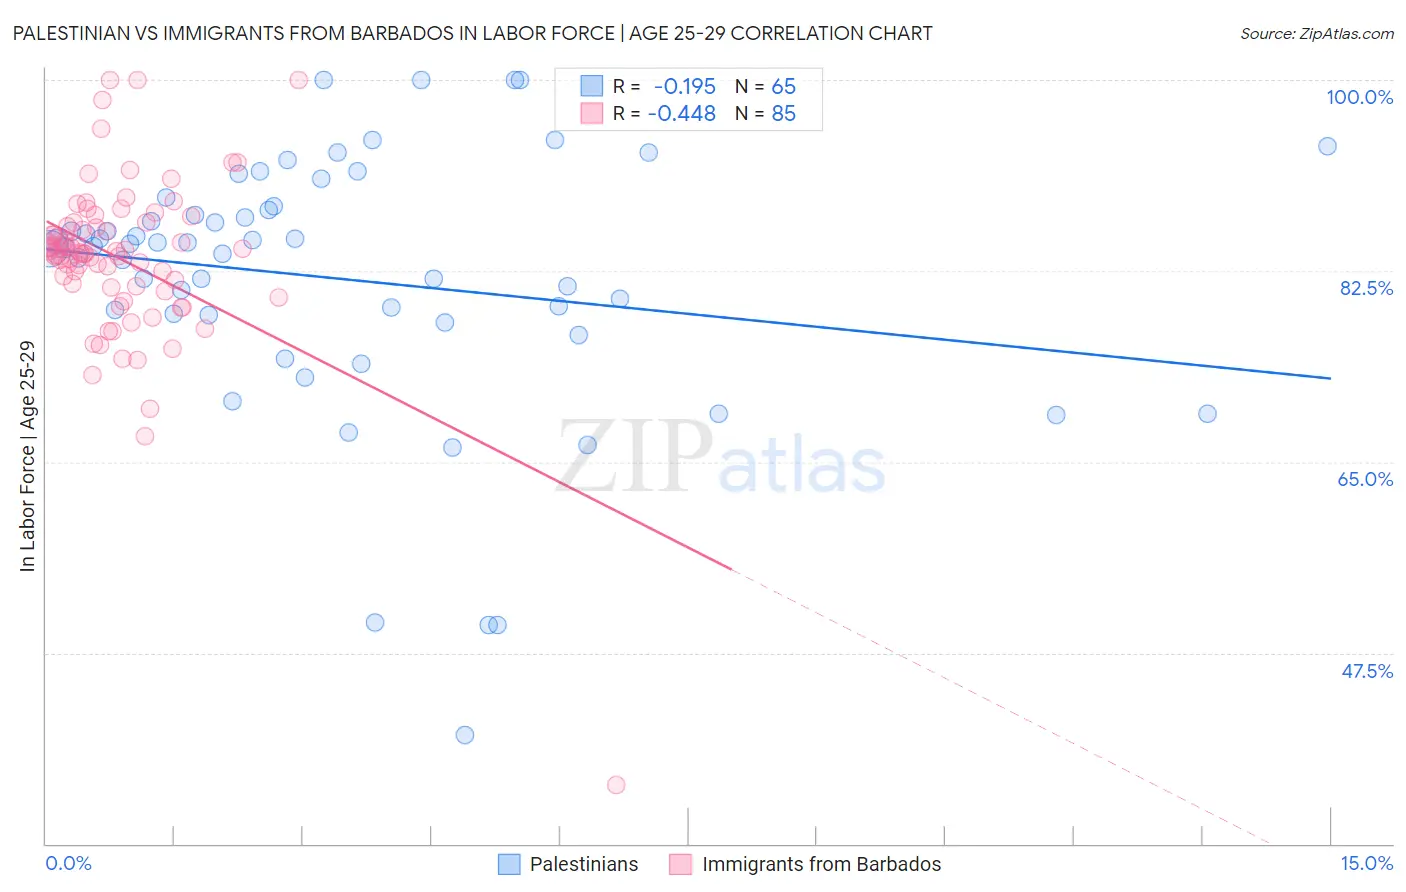
Palestinian vs Immigrants from Barbados In Labor Force | Age 25-29 Correlation Chart
The statistical analysis conducted on geographies consisting of 216,447,152 people shows a poor negative correlation between the proportion of Palestinians and labor force participation rate among population between the ages 25 and 29 in the United States with a correlation coefficient (R) of -0.195 and weighted average of 84.7%. Similarly, the statistical analysis conducted on geographies consisting of 112,776,614 people shows a moderate negative correlation between the proportion of Immigrants from Barbados and labor force participation rate among population between the ages 25 and 29 in the United States with a correlation coefficient (R) of -0.448 and weighted average of 83.4%, a difference of 1.5%.
In Labor Force | Age 25-29 Correlation Summary
| Measurement | Palestinian | Immigrants from Barbados |
| Minimum | 40.0% | 35.4% |
| Maximum | 100.0% | 100.0% |
| Range | 60.0% | 64.6% |
| Mean | 81.8% | 83.6% |
| Median | 84.8% | 84.2% |
| Interquartile 25% (IQ1) | 78.1% | 81.1% |
| Interquartile 75% (IQ3) | 88.2% | 86.8% |
| Interquartile Range (IQR) | 10.1% | 5.7% |
| Standard Deviation (Sample) | 12.1% | 8.0% |
| Standard Deviation (Population) | 12.0% | 7.9% |
Similar Demographics by In Labor Force | Age 25-29
Demographics Similar to Palestinians by In Labor Force | Age 25-29
In terms of in labor force | age 25-29, the demographic groups most similar to Palestinians are Immigrants from Vietnam (84.7%, a difference of 0.0%), Immigrants from Western Europe (84.7%, a difference of 0.0%), Assyrian/Chaldean/Syriac (84.7%, a difference of 0.0%), Celtic (84.7%, a difference of 0.020%), and Tongan (84.7%, a difference of 0.020%).
| Demographics | Rating | Rank | In Labor Force | Age 25-29 |
| Indonesians | 56.5 /100 | #167 | Average 84.7% |
| South Americans | 54.9 /100 | #168 | Average 84.7% |
| Celtics | 52.5 /100 | #169 | Average 84.7% |
| Tongans | 52.4 /100 | #170 | Average 84.7% |
| Immigrants | Vietnam | 50.5 /100 | #171 | Average 84.7% |
| Immigrants | Western Europe | 50.4 /100 | #172 | Average 84.7% |
| Assyrians/Chaldeans/Syriacs | 50.2 /100 | #173 | Average 84.7% |
| Palestinians | 50.0 /100 | #174 | Average 84.7% |
| Hungarians | 47.8 /100 | #175 | Average 84.6% |
| Malaysians | 46.8 /100 | #176 | Average 84.6% |
| Immigrants | China | 45.7 /100 | #177 | Average 84.6% |
| Immigrants | Thailand | 45.2 /100 | #178 | Average 84.6% |
| Immigrants | Argentina | 44.0 /100 | #179 | Average 84.6% |
| Immigrants | South America | 42.9 /100 | #180 | Average 84.6% |
| Immigrants | Norway | 41.9 /100 | #181 | Average 84.6% |
Demographics Similar to Immigrants from Barbados by In Labor Force | Age 25-29
In terms of in labor force | age 25-29, the demographic groups most similar to Immigrants from Barbados are Immigrants from Lebanon (83.4%, a difference of 0.0%), Spanish American (83.4%, a difference of 0.010%), Basque (83.4%, a difference of 0.010%), Aleut (83.4%, a difference of 0.020%), and Honduran (83.4%, a difference of 0.040%).
| Demographics | Rating | Rank | In Labor Force | Age 25-29 |
| Immigrants | Fiji | 0.1 /100 | #262 | Tragic 83.6% |
| West Indians | 0.1 /100 | #263 | Tragic 83.5% |
| Puget Sound Salish | 0.1 /100 | #264 | Tragic 83.5% |
| Cubans | 0.1 /100 | #265 | Tragic 83.5% |
| Aleuts | 0.0 /100 | #266 | Tragic 83.4% |
| Spanish Americans | 0.0 /100 | #267 | Tragic 83.4% |
| Immigrants | Lebanon | 0.0 /100 | #268 | Tragic 83.4% |
| Immigrants | Barbados | 0.0 /100 | #269 | Tragic 83.4% |
| Basques | 0.0 /100 | #270 | Tragic 83.4% |
| Hondurans | 0.0 /100 | #271 | Tragic 83.4% |
| Immigrants | Caribbean | 0.0 /100 | #272 | Tragic 83.4% |
| Immigrants | Dominica | 0.0 /100 | #273 | Tragic 83.4% |
| Marshallese | 0.0 /100 | #274 | Tragic 83.3% |
| Samoans | 0.0 /100 | #275 | Tragic 83.3% |
| Immigrants | Honduras | 0.0 /100 | #276 | Tragic 83.3% |