Palestinian vs Burmese In Labor Force | Age > 16
COMPARE
Palestinian
Burmese
In Labor Force | Age > 16
In Labor Force | Age > 16 Comparison
Palestinians
Burmese
65.9%
IN LABOR FORCE | AGE > 16
98.5/ 100
METRIC RATING
104th/ 347
METRIC RANK
66.2%
IN LABOR FORCE | AGE > 16
99.7/ 100
METRIC RATING
71st/ 347
METRIC RANK
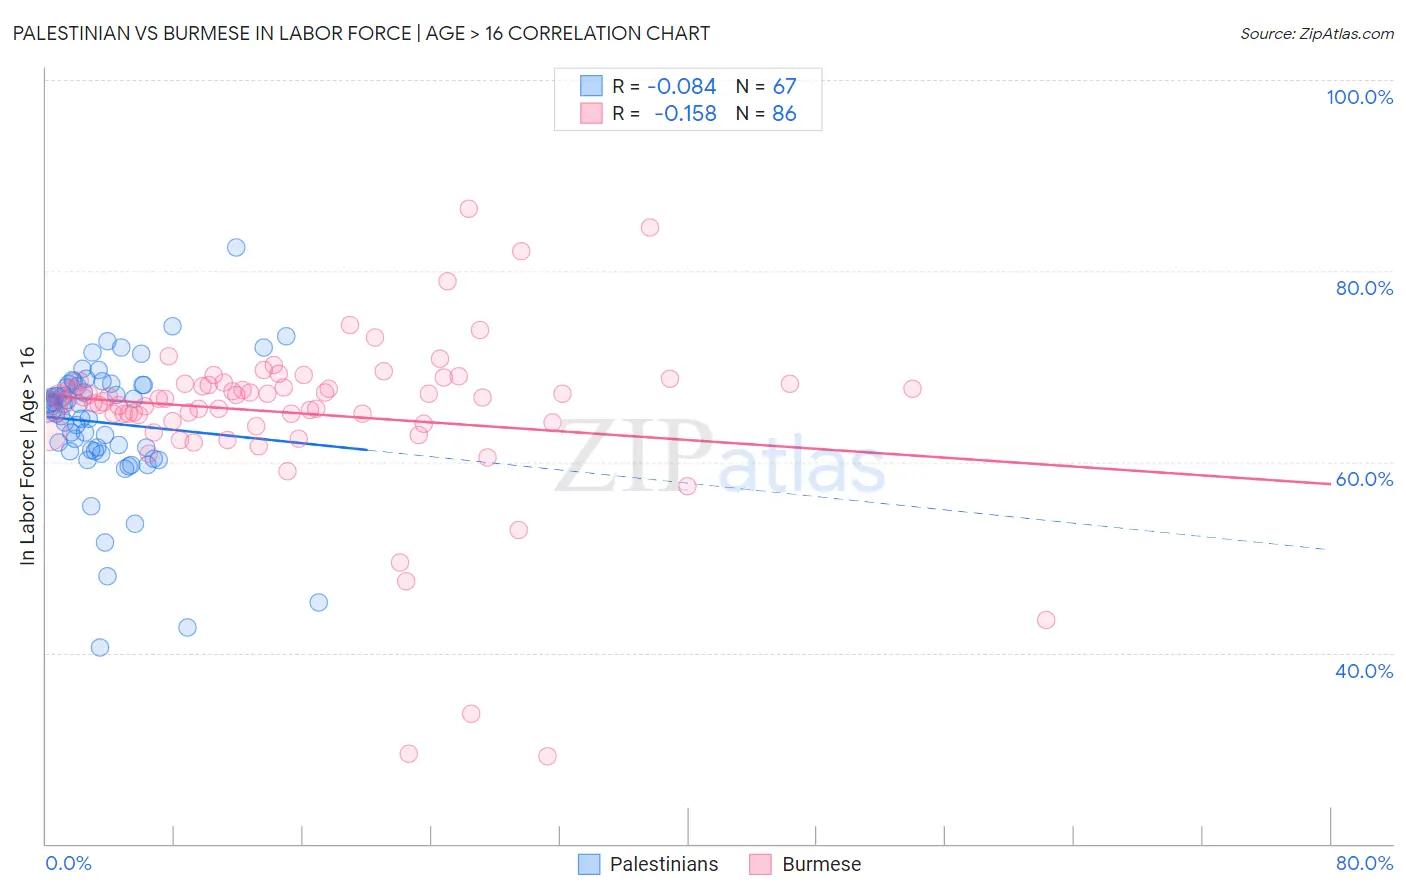
Palestinian vs Burmese In Labor Force | Age > 16 Correlation Chart
The statistical analysis conducted on geographies consisting of 216,467,324 people shows a slight negative correlation between the proportion of Palestinians and labor force participation rate among population ages 16 and over in the United States with a correlation coefficient (R) of -0.084 and weighted average of 65.9%. Similarly, the statistical analysis conducted on geographies consisting of 465,434,629 people shows a poor negative correlation between the proportion of Burmese and labor force participation rate among population ages 16 and over in the United States with a correlation coefficient (R) of -0.158 and weighted average of 66.2%, a difference of 0.47%.
In Labor Force | Age > 16 Correlation Summary
| Measurement | Palestinian | Burmese |
| Minimum | 40.5% | 29.2% |
| Maximum | 82.5% | 86.5% |
| Range | 42.0% | 57.3% |
| Mean | 64.1% | 65.1% |
| Median | 65.8% | 66.6% |
| Interquartile 25% (IQ1) | 61.2% | 64.1% |
| Interquartile 75% (IQ3) | 68.1% | 68.2% |
| Interquartile Range (IQR) | 6.9% | 4.1% |
| Standard Deviation (Sample) | 7.1% | 9.0% |
| Standard Deviation (Population) | 7.0% | 8.9% |
Similar Demographics by In Labor Force | Age > 16
Demographics Similar to Palestinians by In Labor Force | Age > 16
In terms of in labor force | age > 16, the demographic groups most similar to Palestinians are Immigrants from South Eastern Asia (65.9%, a difference of 0.010%), Colombian (65.9%, a difference of 0.010%), Immigrants from Colombia (65.9%, a difference of 0.030%), Uruguayan (65.9%, a difference of 0.030%), and Immigrants from Australia (65.9%, a difference of 0.040%).
| Demographics | Rating | Rank | In Labor Force | Age > 16 |
| Filipinos | 98.9 /100 | #97 | Exceptional 65.9% |
| Immigrants | Chile | 98.7 /100 | #98 | Exceptional 65.9% |
| Immigrants | Australia | 98.7 /100 | #99 | Exceptional 65.9% |
| Okinawans | 98.7 /100 | #100 | Exceptional 65.9% |
| Immigrants | Colombia | 98.6 /100 | #101 | Exceptional 65.9% |
| Uruguayans | 98.6 /100 | #102 | Exceptional 65.9% |
| Immigrants | South Eastern Asia | 98.5 /100 | #103 | Exceptional 65.9% |
| Palestinians | 98.5 /100 | #104 | Exceptional 65.9% |
| Colombians | 98.4 /100 | #105 | Exceptional 65.9% |
| Immigrants | Serbia | 98.1 /100 | #106 | Exceptional 65.8% |
| Immigrants | Poland | 98.1 /100 | #107 | Exceptional 65.8% |
| Immigrants | Spain | 98.0 /100 | #108 | Exceptional 65.8% |
| Immigrants | Japan | 98.0 /100 | #109 | Exceptional 65.8% |
| Japanese | 97.7 /100 | #110 | Exceptional 65.8% |
| Immigrants | Honduras | 97.5 /100 | #111 | Exceptional 65.8% |
Demographics Similar to Burmese by In Labor Force | Age > 16
In terms of in labor force | age > 16, the demographic groups most similar to Burmese are Taiwanese (66.2%, a difference of 0.0%), Immigrants from Vietnam (66.2%, a difference of 0.010%), Immigrants from Korea (66.2%, a difference of 0.010%), Asian (66.2%, a difference of 0.020%), and Immigrants from Singapore (66.2%, a difference of 0.020%).
| Demographics | Rating | Rank | In Labor Force | Age > 16 |
| Peruvians | 99.8 /100 | #64 | Exceptional 66.3% |
| Sri Lankans | 99.8 /100 | #65 | Exceptional 66.3% |
| Jordanians | 99.8 /100 | #66 | Exceptional 66.3% |
| Egyptians | 99.8 /100 | #67 | Exceptional 66.2% |
| Immigrants | Egypt | 99.7 /100 | #68 | Exceptional 66.2% |
| Sub-Saharan Africans | 99.7 /100 | #69 | Exceptional 66.2% |
| Asians | 99.7 /100 | #70 | Exceptional 66.2% |
| Burmese | 99.7 /100 | #71 | Exceptional 66.2% |
| Taiwanese | 99.7 /100 | #72 | Exceptional 66.2% |
| Immigrants | Vietnam | 99.7 /100 | #73 | Exceptional 66.2% |
| Immigrants | Korea | 99.7 /100 | #74 | Exceptional 66.2% |
| Immigrants | Singapore | 99.7 /100 | #75 | Exceptional 66.2% |
| Immigrants | Malaysia | 99.6 /100 | #76 | Exceptional 66.1% |
| Immigrants | Moldova | 99.6 /100 | #77 | Exceptional 66.1% |
| Immigrants | Asia | 99.6 /100 | #78 | Exceptional 66.1% |