Palestinian vs Panamanian In Labor Force | Age > 16
COMPARE
Palestinian
Panamanian
In Labor Force | Age > 16
In Labor Force | Age > 16 Comparison
Palestinians
Panamanians
65.9%
IN LABOR FORCE | AGE > 16
98.5/ 100
METRIC RATING
104th/ 347
METRIC RANK
65.3%
IN LABOR FORCE | AGE > 16
75.2/ 100
METRIC RATING
158th/ 347
METRIC RANK
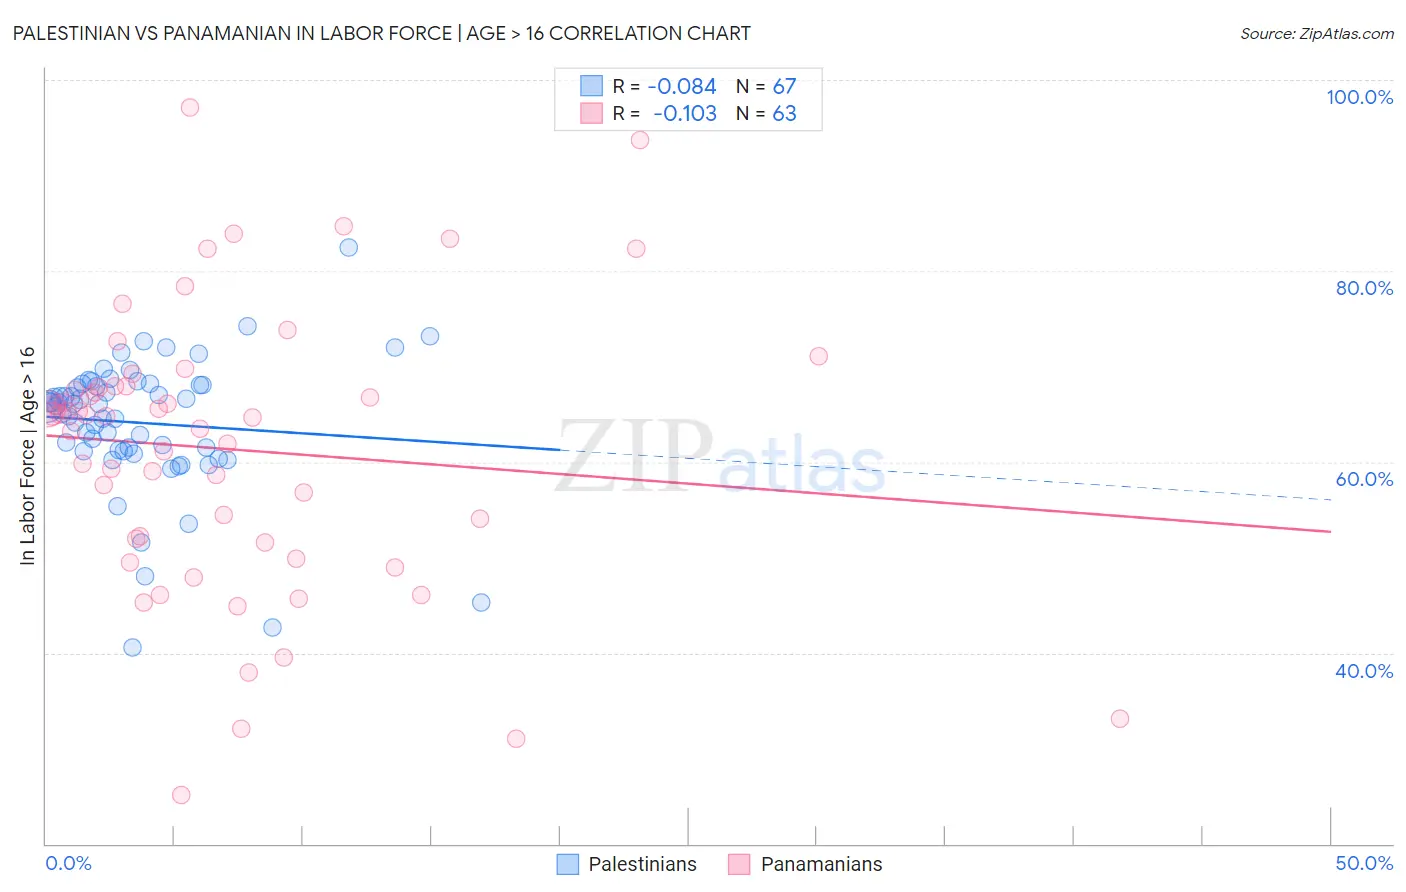
Palestinian vs Panamanian In Labor Force | Age > 16 Correlation Chart
The statistical analysis conducted on geographies consisting of 216,467,324 people shows a slight negative correlation between the proportion of Palestinians and labor force participation rate among population ages 16 and over in the United States with a correlation coefficient (R) of -0.084 and weighted average of 65.9%. Similarly, the statistical analysis conducted on geographies consisting of 281,243,472 people shows a poor negative correlation between the proportion of Panamanians and labor force participation rate among population ages 16 and over in the United States with a correlation coefficient (R) of -0.103 and weighted average of 65.3%, a difference of 0.85%.
In Labor Force | Age > 16 Correlation Summary
| Measurement | Palestinian | Panamanian |
| Minimum | 40.5% | 25.1% |
| Maximum | 82.5% | 97.1% |
| Range | 42.0% | 72.0% |
| Mean | 64.1% | 61.3% |
| Median | 65.8% | 64.8% |
| Interquartile 25% (IQ1) | 61.2% | 51.5% |
| Interquartile 75% (IQ3) | 68.1% | 67.9% |
| Interquartile Range (IQR) | 6.9% | 16.4% |
| Standard Deviation (Sample) | 7.1% | 14.7% |
| Standard Deviation (Population) | 7.0% | 14.6% |
Similar Demographics by In Labor Force | Age > 16
Demographics Similar to Palestinians by In Labor Force | Age > 16
In terms of in labor force | age > 16, the demographic groups most similar to Palestinians are Immigrants from South Eastern Asia (65.9%, a difference of 0.010%), Colombian (65.9%, a difference of 0.010%), Immigrants from Colombia (65.9%, a difference of 0.030%), Uruguayan (65.9%, a difference of 0.030%), and Immigrants from Australia (65.9%, a difference of 0.040%).
| Demographics | Rating | Rank | In Labor Force | Age > 16 |
| Filipinos | 98.9 /100 | #97 | Exceptional 65.9% |
| Immigrants | Chile | 98.7 /100 | #98 | Exceptional 65.9% |
| Immigrants | Australia | 98.7 /100 | #99 | Exceptional 65.9% |
| Okinawans | 98.7 /100 | #100 | Exceptional 65.9% |
| Immigrants | Colombia | 98.6 /100 | #101 | Exceptional 65.9% |
| Uruguayans | 98.6 /100 | #102 | Exceptional 65.9% |
| Immigrants | South Eastern Asia | 98.5 /100 | #103 | Exceptional 65.9% |
| Palestinians | 98.5 /100 | #104 | Exceptional 65.9% |
| Colombians | 98.4 /100 | #105 | Exceptional 65.9% |
| Immigrants | Serbia | 98.1 /100 | #106 | Exceptional 65.8% |
| Immigrants | Poland | 98.1 /100 | #107 | Exceptional 65.8% |
| Immigrants | Spain | 98.0 /100 | #108 | Exceptional 65.8% |
| Immigrants | Japan | 98.0 /100 | #109 | Exceptional 65.8% |
| Japanese | 97.7 /100 | #110 | Exceptional 65.8% |
| Immigrants | Honduras | 97.5 /100 | #111 | Exceptional 65.8% |
Demographics Similar to Panamanians by In Labor Force | Age > 16
In terms of in labor force | age > 16, the demographic groups most similar to Panamanians are Immigrants from Ireland (65.3%, a difference of 0.010%), Immigrants from Russia (65.3%, a difference of 0.010%), Immigrants from Syria (65.3%, a difference of 0.010%), Immigrants from Armenia (65.3%, a difference of 0.020%), and Immigrants from South Africa (65.3%, a difference of 0.030%).
| Demographics | Rating | Rank | In Labor Force | Age > 16 |
| Czechs | 81.5 /100 | #151 | Excellent 65.4% |
| Yugoslavians | 81.3 /100 | #152 | Excellent 65.4% |
| Immigrants | China | 80.5 /100 | #153 | Excellent 65.4% |
| Immigrants | Eastern Europe | 78.3 /100 | #154 | Good 65.4% |
| Immigrants | Armenia | 76.6 /100 | #155 | Good 65.3% |
| Immigrants | Ireland | 75.9 /100 | #156 | Good 65.3% |
| Immigrants | Russia | 75.7 /100 | #157 | Good 65.3% |
| Panamanians | 75.2 /100 | #158 | Good 65.3% |
| Immigrants | Syria | 74.6 /100 | #159 | Good 65.3% |
| Immigrants | South Africa | 73.5 /100 | #160 | Good 65.3% |
| Australians | 71.3 /100 | #161 | Good 65.3% |
| Albanians | 70.8 /100 | #162 | Good 65.3% |
| South Africans | 69.8 /100 | #163 | Good 65.3% |
| Danes | 68.8 /100 | #164 | Good 65.3% |
| Immigrants | Kazakhstan | 68.1 /100 | #165 | Good 65.3% |