Thai vs Spanish American Indian In Labor Force | Age 30-34
COMPARE
Thai
Spanish American Indian
In Labor Force | Age 30-34
In Labor Force | Age 30-34 Comparison
Thais
Spanish American Indians
85.2%
IN LABOR FORCE | AGE 30-34
97.2/ 100
METRIC RATING
97th/ 347
METRIC RANK
82.2%
IN LABOR FORCE | AGE 30-34
0.0/ 100
METRIC RATING
306th/ 347
METRIC RANK
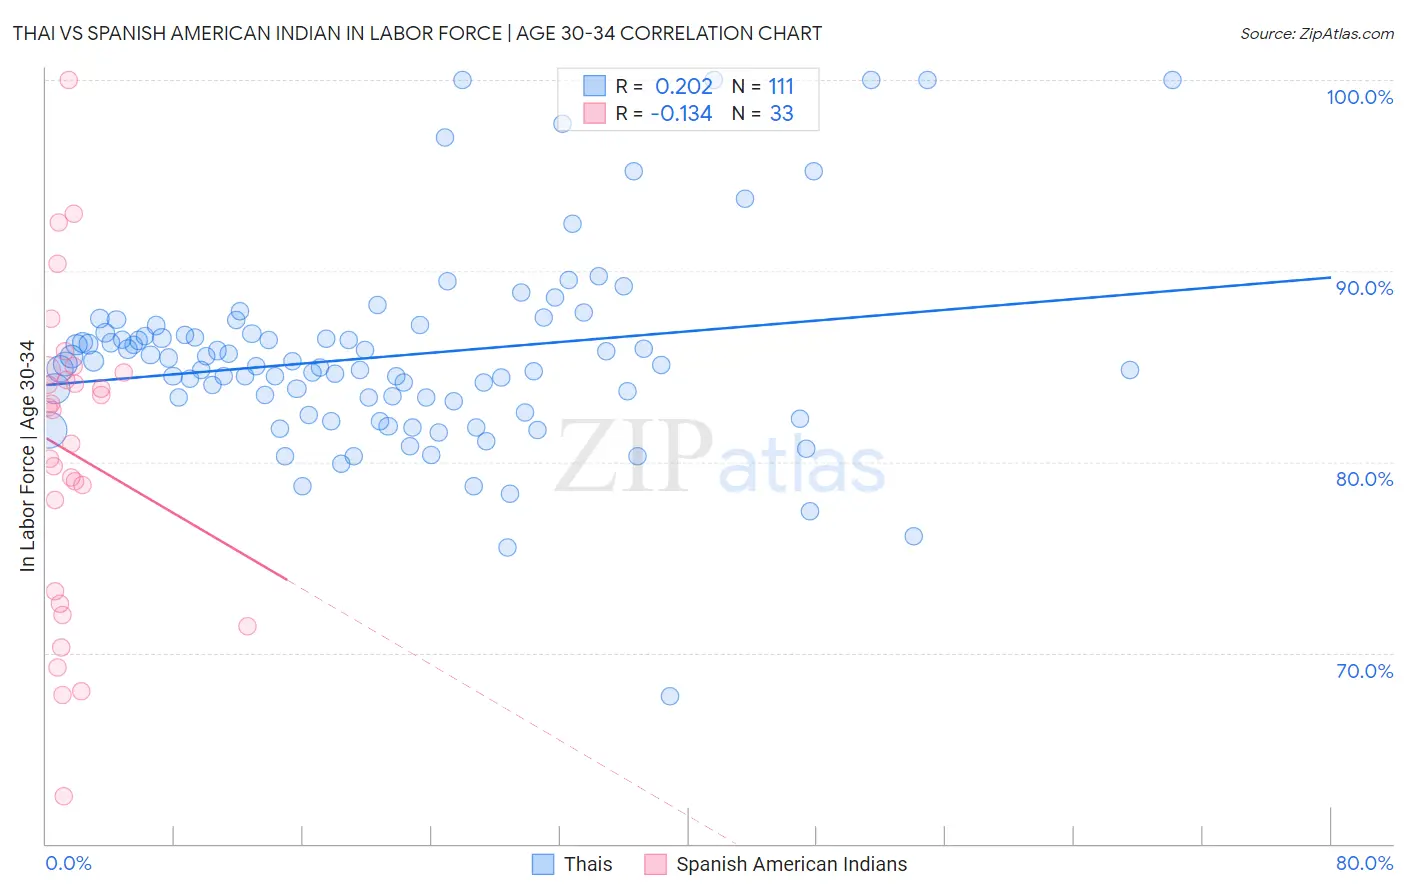
Thai vs Spanish American Indian In Labor Force | Age 30-34 Correlation Chart
The statistical analysis conducted on geographies consisting of 475,385,587 people shows a weak positive correlation between the proportion of Thais and labor force participation rate among population between the ages 30 and 34 in the United States with a correlation coefficient (R) of 0.202 and weighted average of 85.2%. Similarly, the statistical analysis conducted on geographies consisting of 73,143,420 people shows a poor negative correlation between the proportion of Spanish American Indians and labor force participation rate among population between the ages 30 and 34 in the United States with a correlation coefficient (R) of -0.134 and weighted average of 82.2%, a difference of 3.6%.
In Labor Force | Age 30-34 Correlation Summary
| Measurement | Thai | Spanish American Indian |
| Minimum | 67.7% | 62.5% |
| Maximum | 100.0% | 100.0% |
| Range | 32.3% | 37.5% |
| Mean | 85.5% | 80.5% |
| Median | 85.1% | 82.7% |
| Interquartile 25% (IQ1) | 83.1% | 72.9% |
| Interquartile 75% (IQ3) | 86.7% | 84.7% |
| Interquartile Range (IQR) | 3.5% | 11.8% |
| Standard Deviation (Sample) | 5.1% | 8.2% |
| Standard Deviation (Population) | 5.1% | 8.1% |
Similar Demographics by In Labor Force | Age 30-34
Demographics Similar to Thais by In Labor Force | Age 30-34
In terms of in labor force | age 30-34, the demographic groups most similar to Thais are Immigrants from Korea (85.2%, a difference of 0.0%), Immigrants from Uganda (85.2%, a difference of 0.0%), Belgian (85.2%, a difference of 0.0%), Immigrants from India (85.2%, a difference of 0.010%), and Sudanese (85.2%, a difference of 0.010%).
| Demographics | Rating | Rank | In Labor Force | Age 30-34 |
| Burmese | 97.9 /100 | #90 | Exceptional 85.3% |
| Immigrants | Moldova | 97.9 /100 | #91 | Exceptional 85.3% |
| German Russians | 97.7 /100 | #92 | Exceptional 85.2% |
| Immigrants | Norway | 97.6 /100 | #93 | Exceptional 85.2% |
| Swedes | 97.5 /100 | #94 | Exceptional 85.2% |
| Immigrants | India | 97.4 /100 | #95 | Exceptional 85.2% |
| Immigrants | Korea | 97.3 /100 | #96 | Exceptional 85.2% |
| Thais | 97.2 /100 | #97 | Exceptional 85.2% |
| Immigrants | Uganda | 97.2 /100 | #98 | Exceptional 85.2% |
| Belgians | 97.2 /100 | #99 | Exceptional 85.2% |
| Sudanese | 97.1 /100 | #100 | Exceptional 85.2% |
| Immigrants | Belarus | 96.9 /100 | #101 | Exceptional 85.2% |
| Immigrants | Austria | 96.8 /100 | #102 | Exceptional 85.2% |
| Ukrainians | 96.6 /100 | #103 | Exceptional 85.2% |
| Immigrants | Ghana | 96.5 /100 | #104 | Exceptional 85.2% |
Demographics Similar to Spanish American Indians by In Labor Force | Age 30-34
In terms of in labor force | age 30-34, the demographic groups most similar to Spanish American Indians are Osage (82.3%, a difference of 0.020%), Menominee (82.2%, a difference of 0.060%), Tlingit-Haida (82.3%, a difference of 0.090%), Puget Sound Salish (82.1%, a difference of 0.16%), and Immigrants from Micronesia (82.4%, a difference of 0.17%).
| Demographics | Rating | Rank | In Labor Force | Age 30-34 |
| Immigrants | Central America | 0.0 /100 | #299 | Tragic 82.5% |
| Hmong | 0.0 /100 | #300 | Tragic 82.4% |
| Hispanics or Latinos | 0.0 /100 | #301 | Tragic 82.4% |
| Ottawa | 0.0 /100 | #302 | Tragic 82.4% |
| Immigrants | Micronesia | 0.0 /100 | #303 | Tragic 82.4% |
| Tlingit-Haida | 0.0 /100 | #304 | Tragic 82.3% |
| Osage | 0.0 /100 | #305 | Tragic 82.3% |
| Spanish American Indians | 0.0 /100 | #306 | Tragic 82.2% |
| Menominee | 0.0 /100 | #307 | Tragic 82.2% |
| Puget Sound Salish | 0.0 /100 | #308 | Tragic 82.1% |
| Immigrants | Mexico | 0.0 /100 | #309 | Tragic 82.0% |
| Cajuns | 0.0 /100 | #310 | Tragic 82.0% |
| Chickasaw | 0.0 /100 | #311 | Tragic 81.9% |
| Mexicans | 0.0 /100 | #312 | Tragic 81.9% |
| Iroquois | 0.0 /100 | #313 | Tragic 81.9% |