Immigrants from Greece vs Spanish American Indian In Labor Force | Age 30-34
COMPARE
Immigrants from Greece
Spanish American Indian
In Labor Force | Age 30-34
In Labor Force | Age 30-34 Comparison
Immigrants from Greece
Spanish American Indians
85.7%
IN LABOR FORCE | AGE 30-34
99.9/ 100
METRIC RATING
38th/ 347
METRIC RANK
82.2%
IN LABOR FORCE | AGE 30-34
0.0/ 100
METRIC RATING
306th/ 347
METRIC RANK
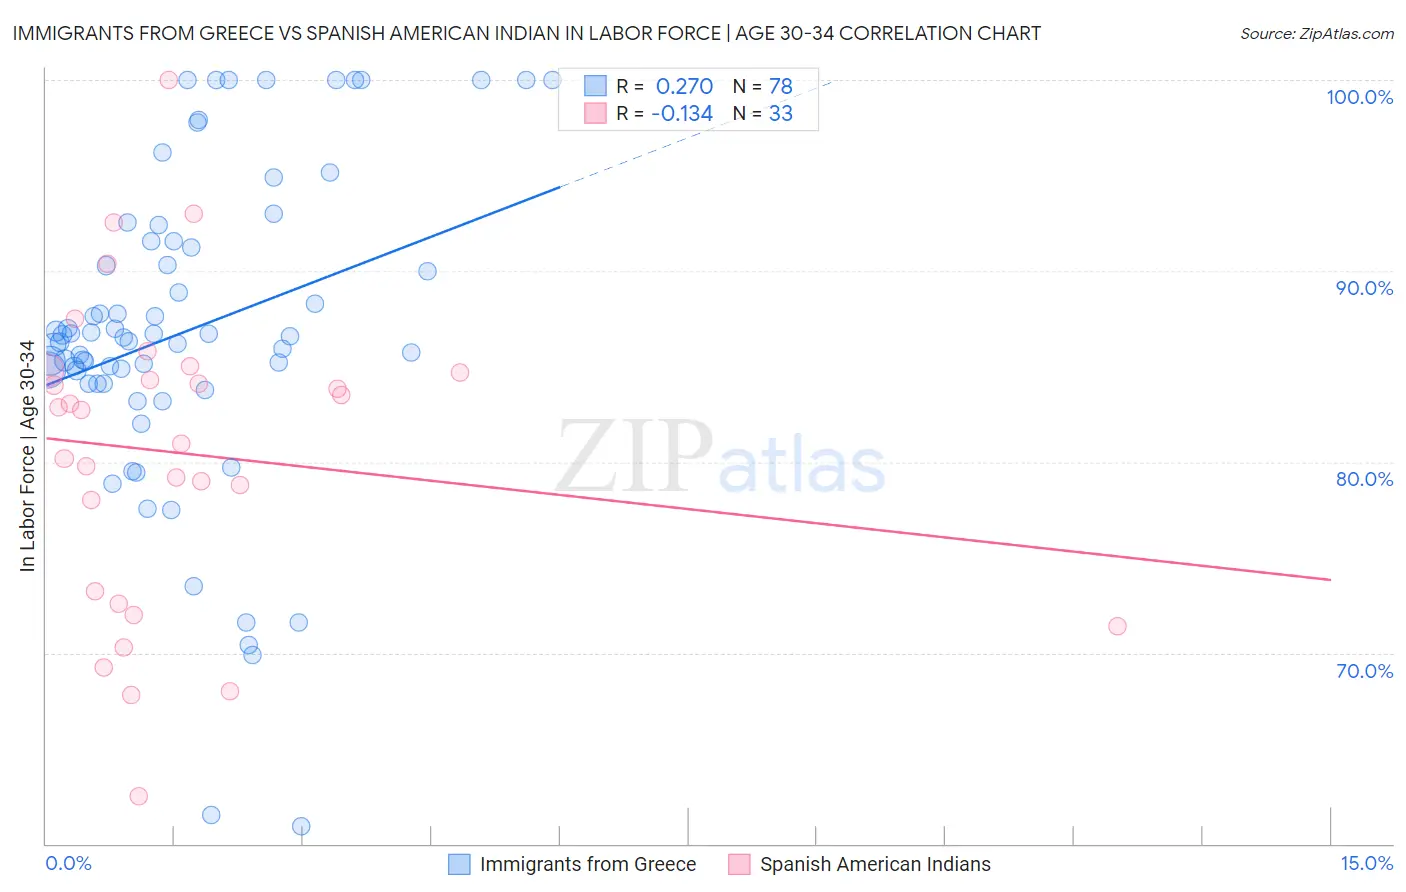
Immigrants from Greece vs Spanish American Indian In Labor Force | Age 30-34 Correlation Chart
The statistical analysis conducted on geographies consisting of 216,816,273 people shows a weak positive correlation between the proportion of Immigrants from Greece and labor force participation rate among population between the ages 30 and 34 in the United States with a correlation coefficient (R) of 0.270 and weighted average of 85.7%. Similarly, the statistical analysis conducted on geographies consisting of 73,143,420 people shows a poor negative correlation between the proportion of Spanish American Indians and labor force participation rate among population between the ages 30 and 34 in the United States with a correlation coefficient (R) of -0.134 and weighted average of 82.2%, a difference of 4.3%.
In Labor Force | Age 30-34 Correlation Summary
| Measurement | Immigrants from Greece | Spanish American Indian |
| Minimum | 60.9% | 62.5% |
| Maximum | 100.0% | 100.0% |
| Range | 39.1% | 37.5% |
| Mean | 86.9% | 80.5% |
| Median | 86.6% | 82.7% |
| Interquartile 25% (IQ1) | 84.1% | 72.9% |
| Interquartile 75% (IQ3) | 91.5% | 84.7% |
| Interquartile Range (IQR) | 7.4% | 11.8% |
| Standard Deviation (Sample) | 8.4% | 8.2% |
| Standard Deviation (Population) | 8.3% | 8.1% |
Similar Demographics by In Labor Force | Age 30-34
Demographics Similar to Immigrants from Greece by In Labor Force | Age 30-34
In terms of in labor force | age 30-34, the demographic groups most similar to Immigrants from Greece are Albanian (85.7%, a difference of 0.010%), Norwegian (85.7%, a difference of 0.010%), Ugandan (85.8%, a difference of 0.020%), Serbian (85.8%, a difference of 0.020%), and Immigrants from Bosnia and Herzegovina (85.8%, a difference of 0.030%).
| Demographics | Rating | Rank | In Labor Force | Age 30-34 |
| Paraguayans | 99.9 /100 | #31 | Exceptional 85.8% |
| Cypriots | 99.9 /100 | #32 | Exceptional 85.8% |
| Immigrants | Bosnia and Herzegovina | 99.9 /100 | #33 | Exceptional 85.8% |
| Ugandans | 99.9 /100 | #34 | Exceptional 85.8% |
| Serbians | 99.9 /100 | #35 | Exceptional 85.8% |
| Albanians | 99.9 /100 | #36 | Exceptional 85.7% |
| Norwegians | 99.9 /100 | #37 | Exceptional 85.7% |
| Immigrants | Greece | 99.9 /100 | #38 | Exceptional 85.7% |
| Eastern Europeans | 99.9 /100 | #39 | Exceptional 85.7% |
| Turks | 99.9 /100 | #40 | Exceptional 85.7% |
| Immigrants | Italy | 99.9 /100 | #41 | Exceptional 85.7% |
| Zimbabweans | 99.8 /100 | #42 | Exceptional 85.6% |
| Immigrants | Lithuania | 99.8 /100 | #43 | Exceptional 85.6% |
| Immigrants | Sri Lanka | 99.8 /100 | #44 | Exceptional 85.6% |
| Immigrants | Nepal | 99.8 /100 | #45 | Exceptional 85.6% |
Demographics Similar to Spanish American Indians by In Labor Force | Age 30-34
In terms of in labor force | age 30-34, the demographic groups most similar to Spanish American Indians are Osage (82.3%, a difference of 0.020%), Menominee (82.2%, a difference of 0.060%), Tlingit-Haida (82.3%, a difference of 0.090%), Puget Sound Salish (82.1%, a difference of 0.16%), and Immigrants from Micronesia (82.4%, a difference of 0.17%).
| Demographics | Rating | Rank | In Labor Force | Age 30-34 |
| Immigrants | Central America | 0.0 /100 | #299 | Tragic 82.5% |
| Hmong | 0.0 /100 | #300 | Tragic 82.4% |
| Hispanics or Latinos | 0.0 /100 | #301 | Tragic 82.4% |
| Ottawa | 0.0 /100 | #302 | Tragic 82.4% |
| Immigrants | Micronesia | 0.0 /100 | #303 | Tragic 82.4% |
| Tlingit-Haida | 0.0 /100 | #304 | Tragic 82.3% |
| Osage | 0.0 /100 | #305 | Tragic 82.3% |
| Spanish American Indians | 0.0 /100 | #306 | Tragic 82.2% |
| Menominee | 0.0 /100 | #307 | Tragic 82.2% |
| Puget Sound Salish | 0.0 /100 | #308 | Tragic 82.1% |
| Immigrants | Mexico | 0.0 /100 | #309 | Tragic 82.0% |
| Cajuns | 0.0 /100 | #310 | Tragic 82.0% |
| Chickasaw | 0.0 /100 | #311 | Tragic 81.9% |
| Mexicans | 0.0 /100 | #312 | Tragic 81.9% |
| Iroquois | 0.0 /100 | #313 | Tragic 81.9% |