Norwegian vs White/Caucasian In Labor Force | Age 45-54
COMPARE
Norwegian
White/Caucasian
In Labor Force | Age 45-54
In Labor Force | Age 45-54 Comparison
Norwegians
Whites/Caucasians
84.4%
IN LABOR FORCE | AGE 45-54
100.0/ 100
METRIC RATING
10th/ 347
METRIC RANK
81.9%
IN LABOR FORCE | AGE 45-54
0.7/ 100
METRIC RATING
242nd/ 347
METRIC RANK
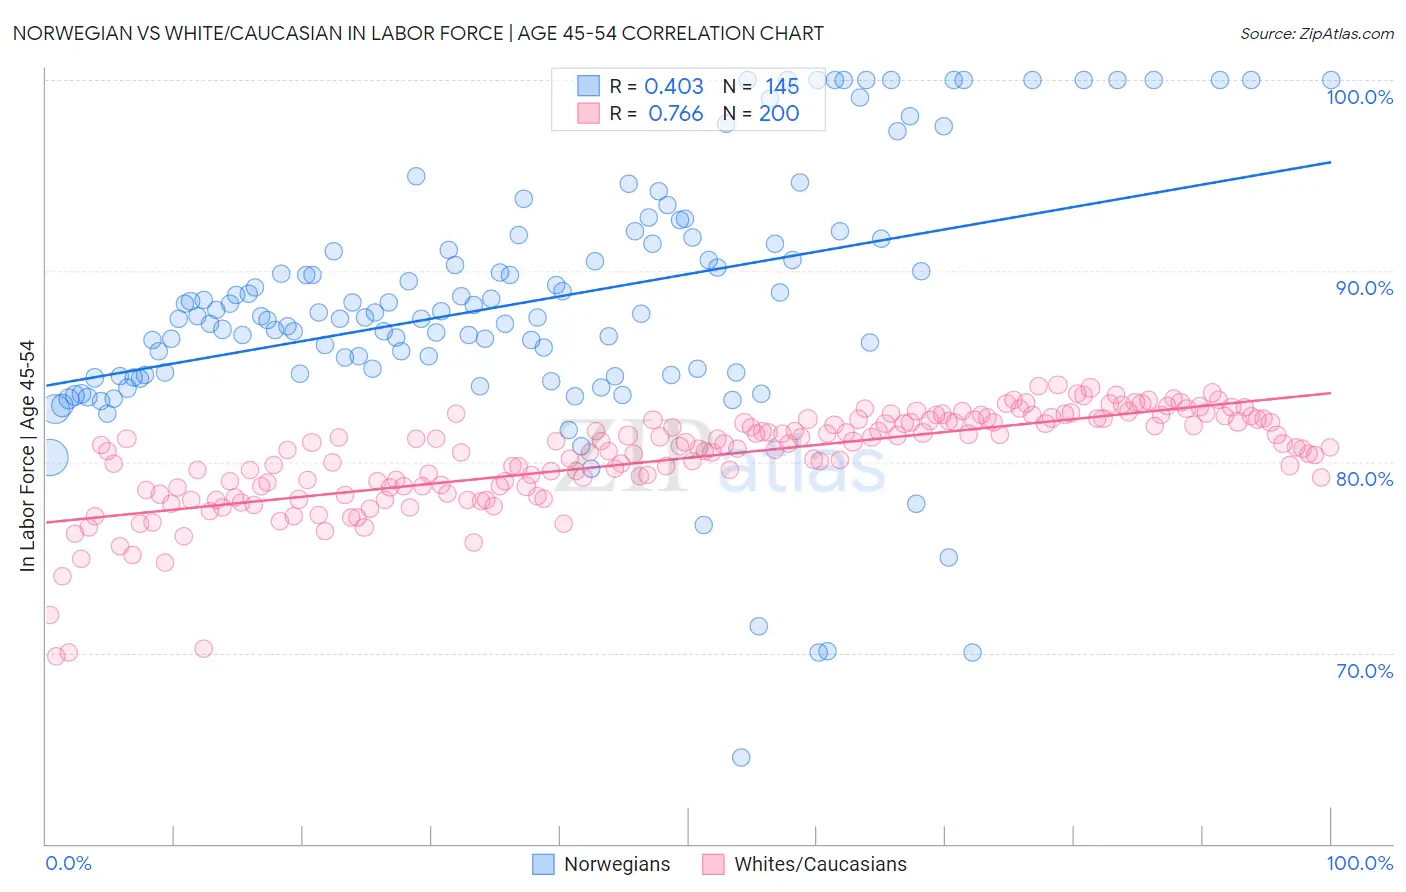
Norwegian vs White/Caucasian In Labor Force | Age 45-54 Correlation Chart
The statistical analysis conducted on geographies consisting of 532,809,238 people shows a moderate positive correlation between the proportion of Norwegians and labor force participation rate among population between the ages 45 and 54 in the United States with a correlation coefficient (R) of 0.403 and weighted average of 84.4%. Similarly, the statistical analysis conducted on geographies consisting of 583,949,283 people shows a strong positive correlation between the proportion of Whites/Caucasians and labor force participation rate among population between the ages 45 and 54 in the United States with a correlation coefficient (R) of 0.766 and weighted average of 81.9%, a difference of 3.1%.
In Labor Force | Age 45-54 Correlation Summary
| Measurement | Norwegian | White/Caucasian |
| Minimum | 64.5% | 69.8% |
| Maximum | 100.0% | 84.0% |
| Range | 35.5% | 14.2% |
| Mean | 88.4% | 80.2% |
| Median | 87.6% | 80.8% |
| Interquartile 25% (IQ1) | 84.6% | 78.7% |
| Interquartile 75% (IQ3) | 91.6% | 82.2% |
| Interquartile Range (IQR) | 7.0% | 3.4% |
| Standard Deviation (Sample) | 6.7% | 2.6% |
| Standard Deviation (Population) | 6.6% | 2.6% |
Similar Demographics by In Labor Force | Age 45-54
Demographics Similar to Norwegians by In Labor Force | Age 45-54
In terms of in labor force | age 45-54, the demographic groups most similar to Norwegians are Immigrants from Sierra Leone (84.4%, a difference of 0.020%), Thai (84.3%, a difference of 0.090%), Sierra Leonean (84.5%, a difference of 0.13%), Bulgarian (84.2%, a difference of 0.20%), and Immigrants from Cameroon (84.6%, a difference of 0.24%).
| Demographics | Rating | Rank | In Labor Force | Age 45-54 |
| Bolivians | 100.0 /100 | #3 | Exceptional 84.9% |
| Immigrants | Ethiopia | 100.0 /100 | #4 | Exceptional 84.8% |
| Ethiopians | 100.0 /100 | #5 | Exceptional 84.8% |
| Immigrants | India | 100.0 /100 | #6 | Exceptional 84.7% |
| Immigrants | Cameroon | 100.0 /100 | #7 | Exceptional 84.6% |
| Sierra Leoneans | 100.0 /100 | #8 | Exceptional 84.5% |
| Immigrants | Sierra Leone | 100.0 /100 | #9 | Exceptional 84.4% |
| Norwegians | 100.0 /100 | #10 | Exceptional 84.4% |
| Thais | 100.0 /100 | #11 | Exceptional 84.3% |
| Bulgarians | 100.0 /100 | #12 | Exceptional 84.2% |
| Chinese | 99.9 /100 | #13 | Exceptional 84.1% |
| Cambodians | 99.9 /100 | #14 | Exceptional 84.1% |
| Cypriots | 99.9 /100 | #15 | Exceptional 84.1% |
| Immigrants | Nepal | 99.9 /100 | #16 | Exceptional 84.0% |
| Zimbabweans | 99.9 /100 | #17 | Exceptional 84.0% |
Demographics Similar to Whites/Caucasians by In Labor Force | Age 45-54
In terms of in labor force | age 45-54, the demographic groups most similar to Whites/Caucasians are Samoan (81.8%, a difference of 0.010%), Immigrants from Cambodia (81.9%, a difference of 0.040%), Immigrants from Thailand (81.9%, a difference of 0.090%), Immigrants from El Salvador (81.9%, a difference of 0.090%), and Celtic (81.8%, a difference of 0.10%).
| Demographics | Rating | Rank | In Labor Force | Age 45-54 |
| Sub-Saharan Africans | 1.2 /100 | #235 | Tragic 82.0% |
| Basques | 1.2 /100 | #236 | Tragic 82.0% |
| Immigrants | Trinidad and Tobago | 1.2 /100 | #237 | Tragic 82.0% |
| Trinidadians and Tobagonians | 1.1 /100 | #238 | Tragic 81.9% |
| Immigrants | Thailand | 1.0 /100 | #239 | Tragic 81.9% |
| Immigrants | El Salvador | 1.0 /100 | #240 | Tragic 81.9% |
| Immigrants | Cambodia | 0.8 /100 | #241 | Tragic 81.9% |
| Whites/Caucasians | 0.7 /100 | #242 | Tragic 81.9% |
| Samoans | 0.6 /100 | #243 | Tragic 81.8% |
| Celtics | 0.4 /100 | #244 | Tragic 81.8% |
| Alaska Natives | 0.4 /100 | #245 | Tragic 81.8% |
| Alaskan Athabascans | 0.4 /100 | #246 | Tragic 81.8% |
| Central Americans | 0.4 /100 | #247 | Tragic 81.7% |
| Puget Sound Salish | 0.3 /100 | #248 | Tragic 81.7% |
| Hmong | 0.3 /100 | #249 | Tragic 81.7% |