Norwegian vs Immigrants from Zaire In Labor Force | Age 45-54
COMPARE
Norwegian
Immigrants from Zaire
In Labor Force | Age 45-54
In Labor Force | Age 45-54 Comparison
Norwegians
Immigrants from Zaire
84.4%
IN LABOR FORCE | AGE 45-54
100.0/ 100
METRIC RATING
10th/ 347
METRIC RANK
82.8%
IN LABOR FORCE | AGE 45-54
52.9/ 100
METRIC RATING
171st/ 347
METRIC RANK
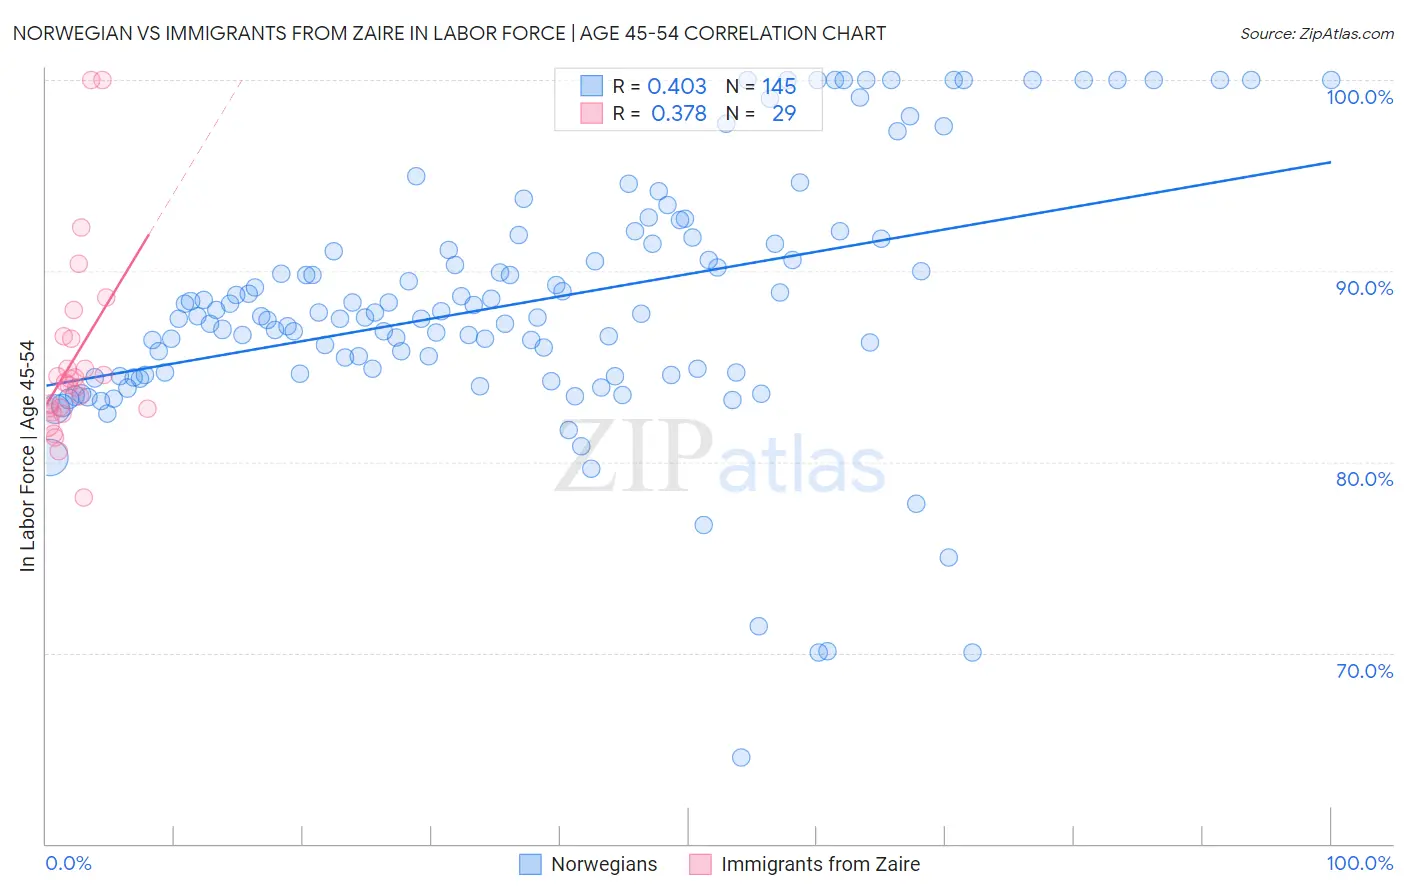
Norwegian vs Immigrants from Zaire In Labor Force | Age 45-54 Correlation Chart
The statistical analysis conducted on geographies consisting of 532,809,238 people shows a moderate positive correlation between the proportion of Norwegians and labor force participation rate among population between the ages 45 and 54 in the United States with a correlation coefficient (R) of 0.403 and weighted average of 84.4%. Similarly, the statistical analysis conducted on geographies consisting of 107,243,471 people shows a mild positive correlation between the proportion of Immigrants from Zaire and labor force participation rate among population between the ages 45 and 54 in the United States with a correlation coefficient (R) of 0.378 and weighted average of 82.8%, a difference of 2.0%.
In Labor Force | Age 45-54 Correlation Summary
| Measurement | Norwegian | Immigrants from Zaire |
| Minimum | 64.5% | 78.2% |
| Maximum | 100.0% | 100.0% |
| Range | 35.5% | 21.8% |
| Mean | 88.4% | 85.4% |
| Median | 87.6% | 84.1% |
| Interquartile 25% (IQ1) | 84.6% | 82.7% |
| Interquartile 75% (IQ3) | 91.6% | 86.5% |
| Interquartile Range (IQR) | 7.0% | 3.8% |
| Standard Deviation (Sample) | 6.7% | 5.0% |
| Standard Deviation (Population) | 6.6% | 4.9% |
Similar Demographics by In Labor Force | Age 45-54
Demographics Similar to Norwegians by In Labor Force | Age 45-54
In terms of in labor force | age 45-54, the demographic groups most similar to Norwegians are Immigrants from Sierra Leone (84.4%, a difference of 0.020%), Thai (84.3%, a difference of 0.090%), Sierra Leonean (84.5%, a difference of 0.13%), Bulgarian (84.2%, a difference of 0.20%), and Immigrants from Cameroon (84.6%, a difference of 0.24%).
| Demographics | Rating | Rank | In Labor Force | Age 45-54 |
| Bolivians | 100.0 /100 | #3 | Exceptional 84.9% |
| Immigrants | Ethiopia | 100.0 /100 | #4 | Exceptional 84.8% |
| Ethiopians | 100.0 /100 | #5 | Exceptional 84.8% |
| Immigrants | India | 100.0 /100 | #6 | Exceptional 84.7% |
| Immigrants | Cameroon | 100.0 /100 | #7 | Exceptional 84.6% |
| Sierra Leoneans | 100.0 /100 | #8 | Exceptional 84.5% |
| Immigrants | Sierra Leone | 100.0 /100 | #9 | Exceptional 84.4% |
| Norwegians | 100.0 /100 | #10 | Exceptional 84.4% |
| Thais | 100.0 /100 | #11 | Exceptional 84.3% |
| Bulgarians | 100.0 /100 | #12 | Exceptional 84.2% |
| Chinese | 99.9 /100 | #13 | Exceptional 84.1% |
| Cambodians | 99.9 /100 | #14 | Exceptional 84.1% |
| Cypriots | 99.9 /100 | #15 | Exceptional 84.1% |
| Immigrants | Nepal | 99.9 /100 | #16 | Exceptional 84.0% |
| Zimbabweans | 99.9 /100 | #17 | Exceptional 84.0% |
Demographics Similar to Immigrants from Zaire by In Labor Force | Age 45-54
In terms of in labor force | age 45-54, the demographic groups most similar to Immigrants from Zaire are Pakistani (82.8%, a difference of 0.0%), Immigrants from Western Africa (82.8%, a difference of 0.010%), Icelander (82.8%, a difference of 0.010%), Nicaraguan (82.8%, a difference of 0.020%), and Swiss (82.8%, a difference of 0.030%).
| Demographics | Rating | Rank | In Labor Force | Age 45-54 |
| German Russians | 61.3 /100 | #164 | Good 82.8% |
| Immigrants | Sudan | 59.9 /100 | #165 | Average 82.8% |
| Immigrants | South Eastern Asia | 57.4 /100 | #166 | Average 82.8% |
| Swiss | 56.5 /100 | #167 | Average 82.8% |
| Immigrants | South Africa | 55.8 /100 | #168 | Average 82.8% |
| Immigrants | Western Africa | 54.1 /100 | #169 | Average 82.8% |
| Pakistanis | 53.2 /100 | #170 | Average 82.8% |
| Immigrants | Zaire | 52.9 /100 | #171 | Average 82.8% |
| Icelanders | 51.8 /100 | #172 | Average 82.8% |
| Nicaraguans | 50.3 /100 | #173 | Average 82.8% |
| Costa Ricans | 50.0 /100 | #174 | Average 82.8% |
| Immigrants | Liberia | 47.9 /100 | #175 | Average 82.7% |
| Northern Europeans | 46.9 /100 | #176 | Average 82.7% |
| Immigrants | Nicaragua | 44.6 /100 | #177 | Average 82.7% |
| Nigerians | 40.5 /100 | #178 | Average 82.7% |