Liberian vs White/Caucasian In Labor Force | Age 45-54
COMPARE
Liberian
White/Caucasian
In Labor Force | Age 45-54
In Labor Force | Age 45-54 Comparison
Liberians
Whites/Caucasians
83.0%
IN LABOR FORCE | AGE 45-54
82.7/ 100
METRIC RATING
133rd/ 347
METRIC RANK
81.9%
IN LABOR FORCE | AGE 45-54
0.7/ 100
METRIC RATING
242nd/ 347
METRIC RANK
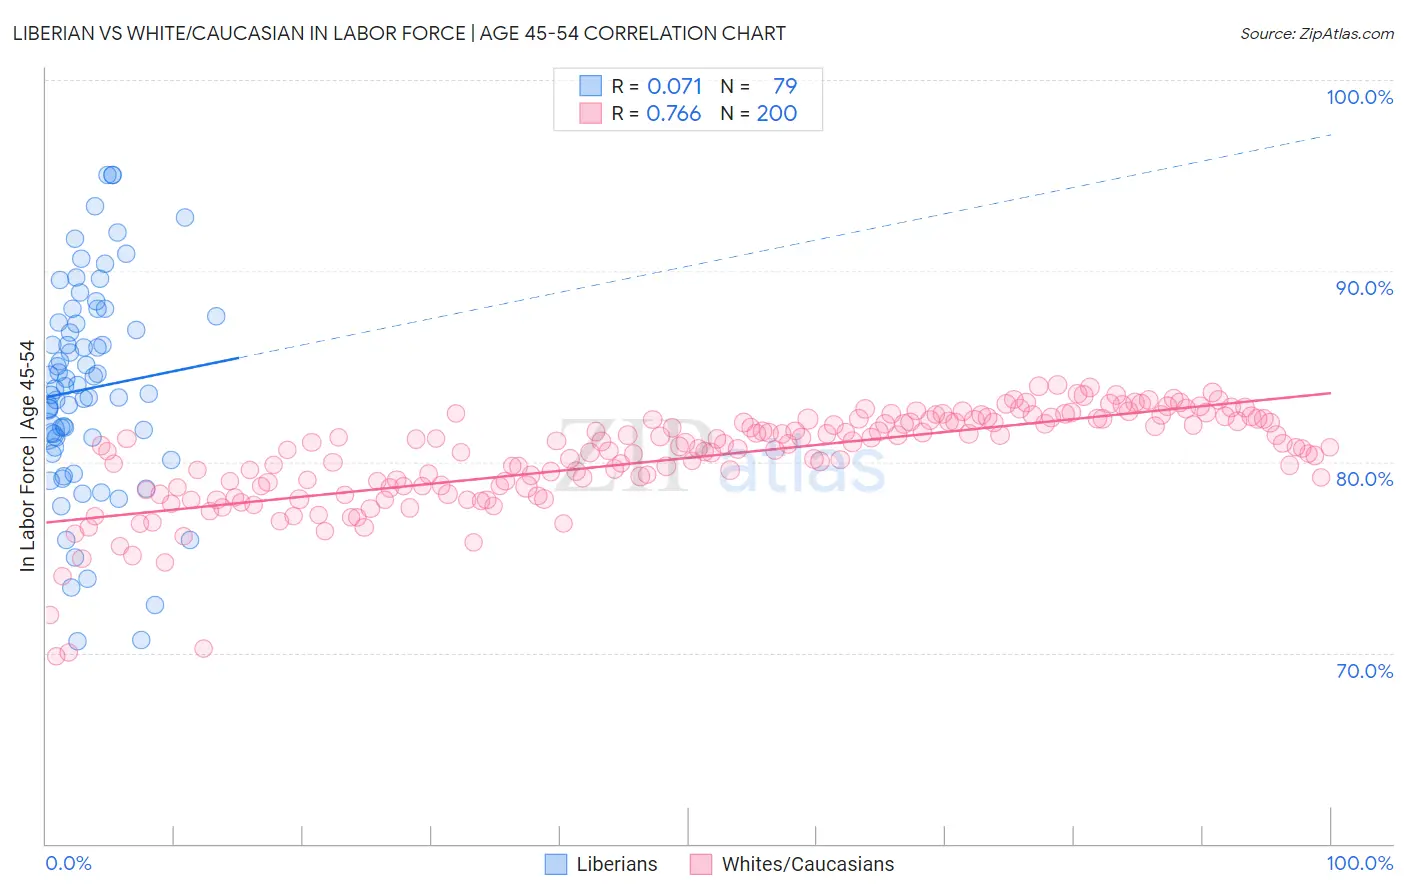
Liberian vs White/Caucasian In Labor Force | Age 45-54 Correlation Chart
The statistical analysis conducted on geographies consisting of 118,034,202 people shows a slight positive correlation between the proportion of Liberians and labor force participation rate among population between the ages 45 and 54 in the United States with a correlation coefficient (R) of 0.071 and weighted average of 83.0%. Similarly, the statistical analysis conducted on geographies consisting of 583,949,283 people shows a strong positive correlation between the proportion of Whites/Caucasians and labor force participation rate among population between the ages 45 and 54 in the United States with a correlation coefficient (R) of 0.766 and weighted average of 81.9%, a difference of 1.5%.
In Labor Force | Age 45-54 Correlation Summary
| Measurement | Liberian | White/Caucasian |
| Minimum | 70.6% | 69.8% |
| Maximum | 95.0% | 84.0% |
| Range | 24.4% | 14.2% |
| Mean | 83.8% | 80.2% |
| Median | 83.8% | 80.8% |
| Interquartile 25% (IQ1) | 80.7% | 78.7% |
| Interquartile 75% (IQ3) | 87.3% | 82.2% |
| Interquartile Range (IQR) | 6.6% | 3.4% |
| Standard Deviation (Sample) | 5.5% | 2.6% |
| Standard Deviation (Population) | 5.4% | 2.6% |
Similar Demographics by In Labor Force | Age 45-54
Demographics Similar to Liberians by In Labor Force | Age 45-54
In terms of in labor force | age 45-54, the demographic groups most similar to Liberians are Immigrants from Ukraine (83.0%, a difference of 0.0%), Finnish (83.1%, a difference of 0.010%), Sudanese (83.0%, a difference of 0.010%), Austrian (83.0%, a difference of 0.020%), and Immigrants from Israel (83.1%, a difference of 0.030%).
| Demographics | Rating | Rank | In Labor Force | Age 45-54 |
| Immigrants | Belgium | 86.4 /100 | #126 | Excellent 83.1% |
| Immigrants | Jordan | 85.2 /100 | #127 | Excellent 83.1% |
| Germans | 85.1 /100 | #128 | Excellent 83.1% |
| Immigrants | Northern Europe | 85.1 /100 | #129 | Excellent 83.1% |
| Immigrants | Israel | 84.7 /100 | #130 | Excellent 83.1% |
| Finns | 83.3 /100 | #131 | Excellent 83.1% |
| Immigrants | Ukraine | 82.9 /100 | #132 | Excellent 83.0% |
| Liberians | 82.7 /100 | #133 | Excellent 83.0% |
| Sudanese | 82.0 /100 | #134 | Excellent 83.0% |
| Austrians | 81.3 /100 | #135 | Excellent 83.0% |
| Immigrants | Kazakhstan | 81.0 /100 | #136 | Excellent 83.0% |
| Immigrants | Spain | 80.4 /100 | #137 | Excellent 83.0% |
| Ghanaians | 79.5 /100 | #138 | Good 83.0% |
| Scandinavians | 78.5 /100 | #139 | Good 83.0% |
| Yugoslavians | 78.3 /100 | #140 | Good 83.0% |
Demographics Similar to Whites/Caucasians by In Labor Force | Age 45-54
In terms of in labor force | age 45-54, the demographic groups most similar to Whites/Caucasians are Samoan (81.8%, a difference of 0.010%), Immigrants from Cambodia (81.9%, a difference of 0.040%), Immigrants from Thailand (81.9%, a difference of 0.090%), Immigrants from El Salvador (81.9%, a difference of 0.090%), and Celtic (81.8%, a difference of 0.10%).
| Demographics | Rating | Rank | In Labor Force | Age 45-54 |
| Sub-Saharan Africans | 1.2 /100 | #235 | Tragic 82.0% |
| Basques | 1.2 /100 | #236 | Tragic 82.0% |
| Immigrants | Trinidad and Tobago | 1.2 /100 | #237 | Tragic 82.0% |
| Trinidadians and Tobagonians | 1.1 /100 | #238 | Tragic 81.9% |
| Immigrants | Thailand | 1.0 /100 | #239 | Tragic 81.9% |
| Immigrants | El Salvador | 1.0 /100 | #240 | Tragic 81.9% |
| Immigrants | Cambodia | 0.8 /100 | #241 | Tragic 81.9% |
| Whites/Caucasians | 0.7 /100 | #242 | Tragic 81.9% |
| Samoans | 0.6 /100 | #243 | Tragic 81.8% |
| Celtics | 0.4 /100 | #244 | Tragic 81.8% |
| Alaska Natives | 0.4 /100 | #245 | Tragic 81.8% |
| Alaskan Athabascans | 0.4 /100 | #246 | Tragic 81.8% |
| Central Americans | 0.4 /100 | #247 | Tragic 81.7% |
| Puget Sound Salish | 0.3 /100 | #248 | Tragic 81.7% |
| Hmong | 0.3 /100 | #249 | Tragic 81.7% |