Immigrants from Korea vs White/Caucasian In Labor Force | Age 45-54
COMPARE
Immigrants from Korea
White/Caucasian
In Labor Force | Age 45-54
In Labor Force | Age 45-54 Comparison
Immigrants from Korea
Whites/Caucasians
83.7%
IN LABOR FORCE | AGE 45-54
99.3/ 100
METRIC RATING
41st/ 347
METRIC RANK
81.9%
IN LABOR FORCE | AGE 45-54
0.7/ 100
METRIC RATING
242nd/ 347
METRIC RANK
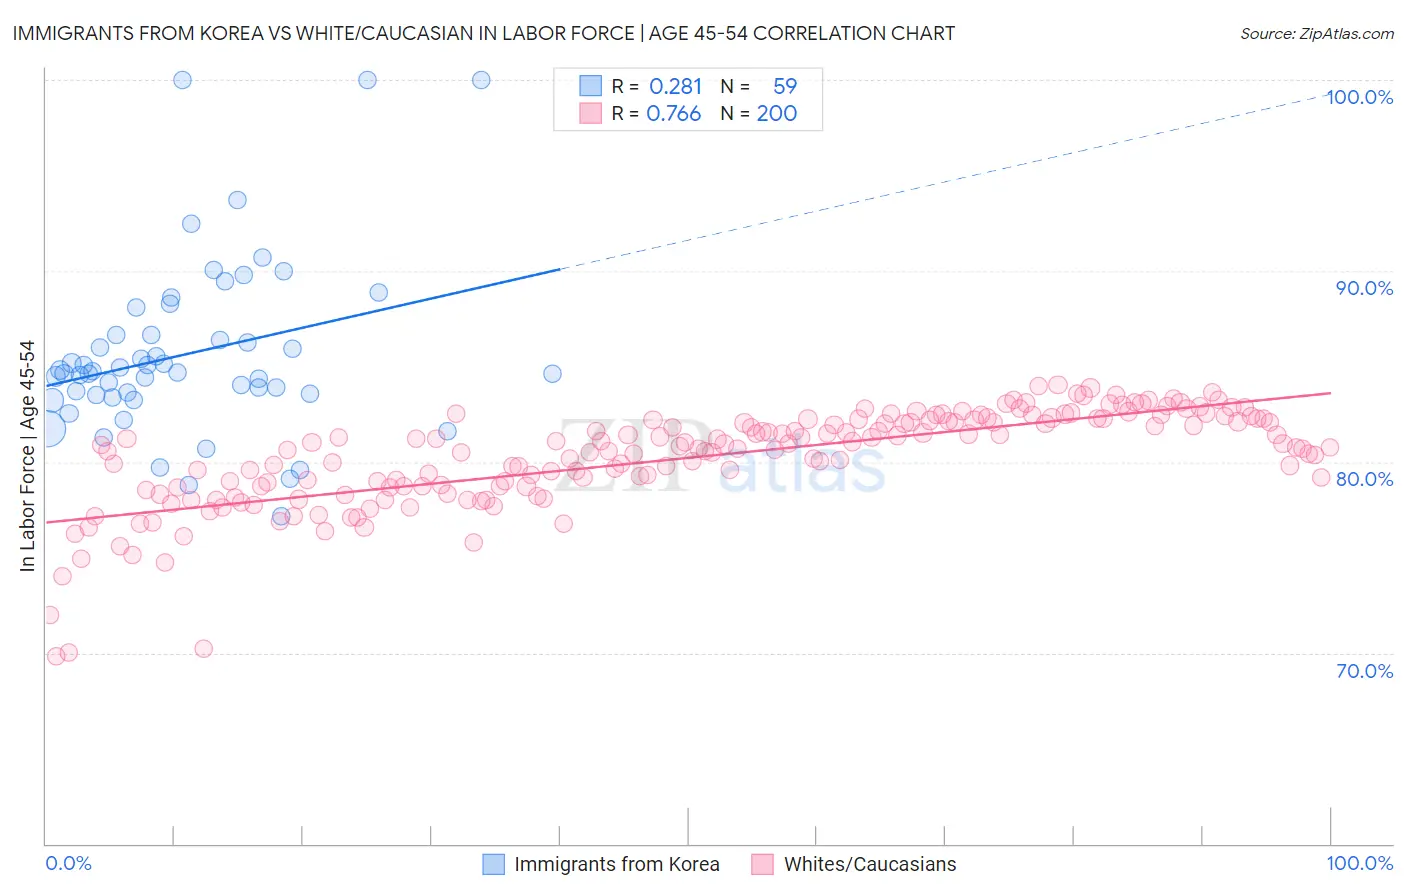
Immigrants from Korea vs White/Caucasian In Labor Force | Age 45-54 Correlation Chart
The statistical analysis conducted on geographies consisting of 415,943,444 people shows a weak positive correlation between the proportion of Immigrants from Korea and labor force participation rate among population between the ages 45 and 54 in the United States with a correlation coefficient (R) of 0.281 and weighted average of 83.7%. Similarly, the statistical analysis conducted on geographies consisting of 583,949,283 people shows a strong positive correlation between the proportion of Whites/Caucasians and labor force participation rate among population between the ages 45 and 54 in the United States with a correlation coefficient (R) of 0.766 and weighted average of 81.9%, a difference of 2.2%.
In Labor Force | Age 45-54 Correlation Summary
| Measurement | Immigrants from Korea | White/Caucasian |
| Minimum | 77.1% | 69.8% |
| Maximum | 100.0% | 84.0% |
| Range | 22.9% | 14.2% |
| Mean | 85.7% | 80.2% |
| Median | 84.7% | 80.8% |
| Interquartile 25% (IQ1) | 83.5% | 78.7% |
| Interquartile 75% (IQ3) | 86.7% | 82.2% |
| Interquartile Range (IQR) | 3.2% | 3.4% |
| Standard Deviation (Sample) | 4.6% | 2.6% |
| Standard Deviation (Population) | 4.6% | 2.6% |
Similar Demographics by In Labor Force | Age 45-54
Demographics Similar to Immigrants from Korea by In Labor Force | Age 45-54
In terms of in labor force | age 45-54, the demographic groups most similar to Immigrants from Korea are Immigrants from Moldova (83.7%, a difference of 0.0%), Immigrants from Uganda (83.7%, a difference of 0.010%), Immigrants from Venezuela (83.7%, a difference of 0.020%), Immigrants from Cuba (83.7%, a difference of 0.020%), and Swedish (83.7%, a difference of 0.030%).
| Demographics | Rating | Rank | In Labor Force | Age 45-54 |
| Kenyans | 99.5 /100 | #34 | Exceptional 83.7% |
| Brazilians | 99.5 /100 | #35 | Exceptional 83.7% |
| Ugandans | 99.5 /100 | #36 | Exceptional 83.7% |
| Swedes | 99.4 /100 | #37 | Exceptional 83.7% |
| Immigrants | Venezuela | 99.4 /100 | #38 | Exceptional 83.7% |
| Immigrants | Cuba | 99.4 /100 | #39 | Exceptional 83.7% |
| Immigrants | Uganda | 99.4 /100 | #40 | Exceptional 83.7% |
| Immigrants | Korea | 99.3 /100 | #41 | Exceptional 83.7% |
| Immigrants | Moldova | 99.3 /100 | #42 | Exceptional 83.7% |
| Venezuelans | 99.2 /100 | #43 | Exceptional 83.6% |
| Burmese | 99.1 /100 | #44 | Exceptional 83.6% |
| Immigrants | Hong Kong | 99.1 /100 | #45 | Exceptional 83.6% |
| Lithuanians | 99.1 /100 | #46 | Exceptional 83.6% |
| Croatians | 99.0 /100 | #47 | Exceptional 83.6% |
| Immigrants | Poland | 99.0 /100 | #48 | Exceptional 83.6% |
Demographics Similar to Whites/Caucasians by In Labor Force | Age 45-54
In terms of in labor force | age 45-54, the demographic groups most similar to Whites/Caucasians are Samoan (81.8%, a difference of 0.010%), Immigrants from Cambodia (81.9%, a difference of 0.040%), Immigrants from Thailand (81.9%, a difference of 0.090%), Immigrants from El Salvador (81.9%, a difference of 0.090%), and Celtic (81.8%, a difference of 0.10%).
| Demographics | Rating | Rank | In Labor Force | Age 45-54 |
| Sub-Saharan Africans | 1.2 /100 | #235 | Tragic 82.0% |
| Basques | 1.2 /100 | #236 | Tragic 82.0% |
| Immigrants | Trinidad and Tobago | 1.2 /100 | #237 | Tragic 82.0% |
| Trinidadians and Tobagonians | 1.1 /100 | #238 | Tragic 81.9% |
| Immigrants | Thailand | 1.0 /100 | #239 | Tragic 81.9% |
| Immigrants | El Salvador | 1.0 /100 | #240 | Tragic 81.9% |
| Immigrants | Cambodia | 0.8 /100 | #241 | Tragic 81.9% |
| Whites/Caucasians | 0.7 /100 | #242 | Tragic 81.9% |
| Samoans | 0.6 /100 | #243 | Tragic 81.8% |
| Celtics | 0.4 /100 | #244 | Tragic 81.8% |
| Alaska Natives | 0.4 /100 | #245 | Tragic 81.8% |
| Alaskan Athabascans | 0.4 /100 | #246 | Tragic 81.8% |
| Central Americans | 0.4 /100 | #247 | Tragic 81.7% |
| Puget Sound Salish | 0.3 /100 | #248 | Tragic 81.7% |
| Hmong | 0.3 /100 | #249 | Tragic 81.7% |