Norwegian vs Liberian In Labor Force | Age 45-54
COMPARE
Norwegian
Liberian
In Labor Force | Age 45-54
In Labor Force | Age 45-54 Comparison
Norwegians
Liberians
84.4%
IN LABOR FORCE | AGE 45-54
100.0/ 100
METRIC RATING
10th/ 347
METRIC RANK
83.0%
IN LABOR FORCE | AGE 45-54
82.7/ 100
METRIC RATING
133rd/ 347
METRIC RANK
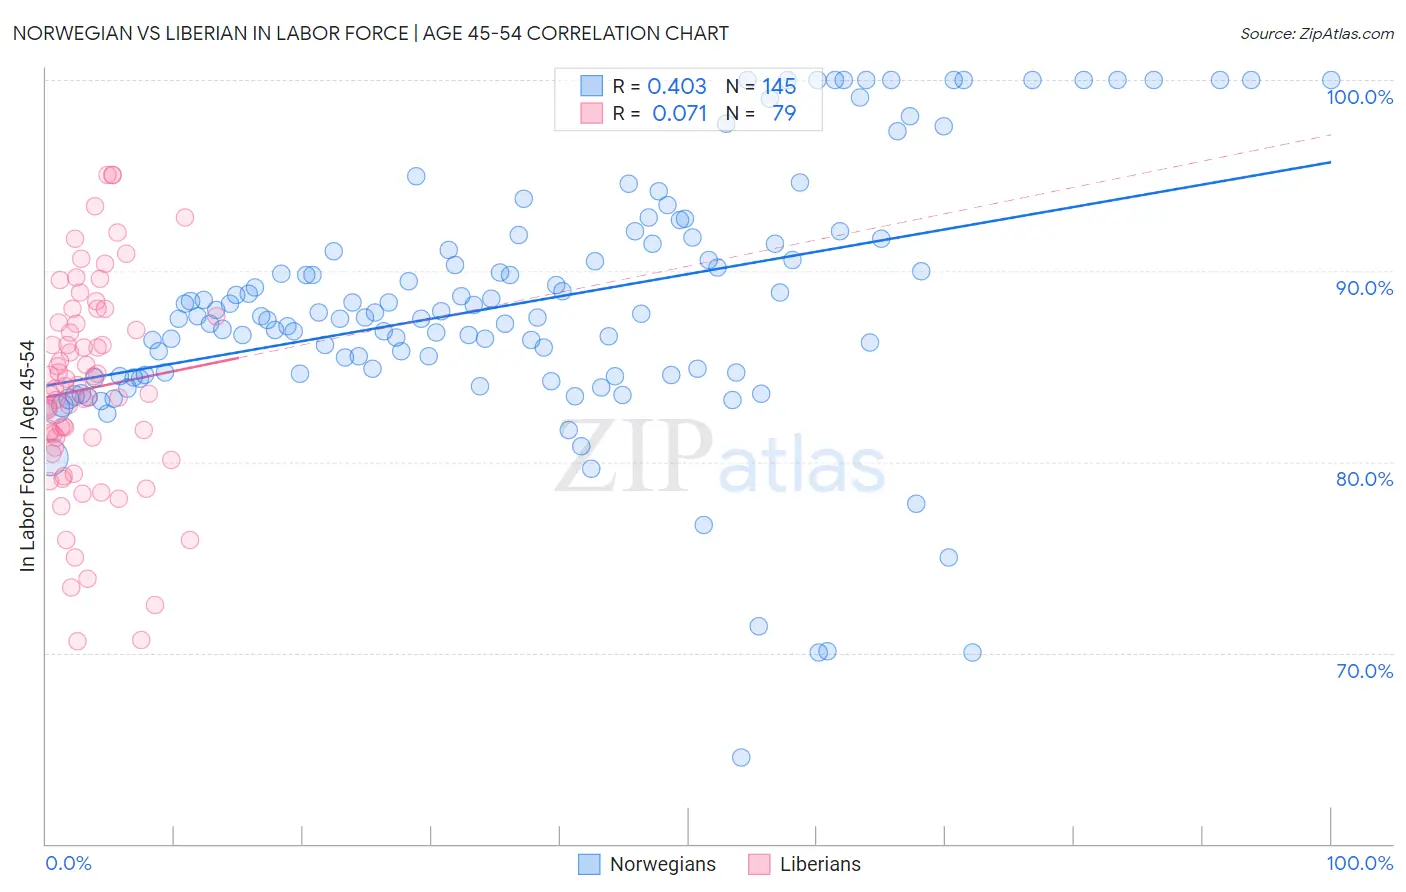
Norwegian vs Liberian In Labor Force | Age 45-54 Correlation Chart
The statistical analysis conducted on geographies consisting of 532,809,238 people shows a moderate positive correlation between the proportion of Norwegians and labor force participation rate among population between the ages 45 and 54 in the United States with a correlation coefficient (R) of 0.403 and weighted average of 84.4%. Similarly, the statistical analysis conducted on geographies consisting of 118,034,202 people shows a slight positive correlation between the proportion of Liberians and labor force participation rate among population between the ages 45 and 54 in the United States with a correlation coefficient (R) of 0.071 and weighted average of 83.0%, a difference of 1.6%.
In Labor Force | Age 45-54 Correlation Summary
| Measurement | Norwegian | Liberian |
| Minimum | 64.5% | 70.6% |
| Maximum | 100.0% | 95.0% |
| Range | 35.5% | 24.4% |
| Mean | 88.4% | 83.8% |
| Median | 87.6% | 83.8% |
| Interquartile 25% (IQ1) | 84.6% | 80.7% |
| Interquartile 75% (IQ3) | 91.6% | 87.3% |
| Interquartile Range (IQR) | 7.0% | 6.6% |
| Standard Deviation (Sample) | 6.7% | 5.5% |
| Standard Deviation (Population) | 6.6% | 5.4% |
Similar Demographics by In Labor Force | Age 45-54
Demographics Similar to Norwegians by In Labor Force | Age 45-54
In terms of in labor force | age 45-54, the demographic groups most similar to Norwegians are Immigrants from Sierra Leone (84.4%, a difference of 0.020%), Thai (84.3%, a difference of 0.090%), Sierra Leonean (84.5%, a difference of 0.13%), Bulgarian (84.2%, a difference of 0.20%), and Immigrants from Cameroon (84.6%, a difference of 0.24%).
| Demographics | Rating | Rank | In Labor Force | Age 45-54 |
| Bolivians | 100.0 /100 | #3 | Exceptional 84.9% |
| Immigrants | Ethiopia | 100.0 /100 | #4 | Exceptional 84.8% |
| Ethiopians | 100.0 /100 | #5 | Exceptional 84.8% |
| Immigrants | India | 100.0 /100 | #6 | Exceptional 84.7% |
| Immigrants | Cameroon | 100.0 /100 | #7 | Exceptional 84.6% |
| Sierra Leoneans | 100.0 /100 | #8 | Exceptional 84.5% |
| Immigrants | Sierra Leone | 100.0 /100 | #9 | Exceptional 84.4% |
| Norwegians | 100.0 /100 | #10 | Exceptional 84.4% |
| Thais | 100.0 /100 | #11 | Exceptional 84.3% |
| Bulgarians | 100.0 /100 | #12 | Exceptional 84.2% |
| Chinese | 99.9 /100 | #13 | Exceptional 84.1% |
| Cambodians | 99.9 /100 | #14 | Exceptional 84.1% |
| Cypriots | 99.9 /100 | #15 | Exceptional 84.1% |
| Immigrants | Nepal | 99.9 /100 | #16 | Exceptional 84.0% |
| Zimbabweans | 99.9 /100 | #17 | Exceptional 84.0% |
Demographics Similar to Liberians by In Labor Force | Age 45-54
In terms of in labor force | age 45-54, the demographic groups most similar to Liberians are Immigrants from Ukraine (83.0%, a difference of 0.0%), Finnish (83.1%, a difference of 0.010%), Sudanese (83.0%, a difference of 0.010%), Austrian (83.0%, a difference of 0.020%), and Immigrants from Israel (83.1%, a difference of 0.030%).
| Demographics | Rating | Rank | In Labor Force | Age 45-54 |
| Immigrants | Belgium | 86.4 /100 | #126 | Excellent 83.1% |
| Immigrants | Jordan | 85.2 /100 | #127 | Excellent 83.1% |
| Germans | 85.1 /100 | #128 | Excellent 83.1% |
| Immigrants | Northern Europe | 85.1 /100 | #129 | Excellent 83.1% |
| Immigrants | Israel | 84.7 /100 | #130 | Excellent 83.1% |
| Finns | 83.3 /100 | #131 | Excellent 83.1% |
| Immigrants | Ukraine | 82.9 /100 | #132 | Excellent 83.0% |
| Liberians | 82.7 /100 | #133 | Excellent 83.0% |
| Sudanese | 82.0 /100 | #134 | Excellent 83.0% |
| Austrians | 81.3 /100 | #135 | Excellent 83.0% |
| Immigrants | Kazakhstan | 81.0 /100 | #136 | Excellent 83.0% |
| Immigrants | Spain | 80.4 /100 | #137 | Excellent 83.0% |
| Ghanaians | 79.5 /100 | #138 | Good 83.0% |
| Scandinavians | 78.5 /100 | #139 | Good 83.0% |
| Yugoslavians | 78.3 /100 | #140 | Good 83.0% |