Nonimmigrants vs Ugandan In Labor Force | Age 16-19
COMPARE
Nonimmigrants
Ugandan
In Labor Force | Age 16-19
In Labor Force | Age 16-19 Comparison
Nonimmigrants
Ugandans
40.1%
IN LABOR FORCE | AGE 16-19
100.0/ 100
METRIC RATING
66th/ 347
METRIC RANK
38.9%
IN LABOR FORCE | AGE 16-19
99.3/ 100
METRIC RATING
98th/ 347
METRIC RANK
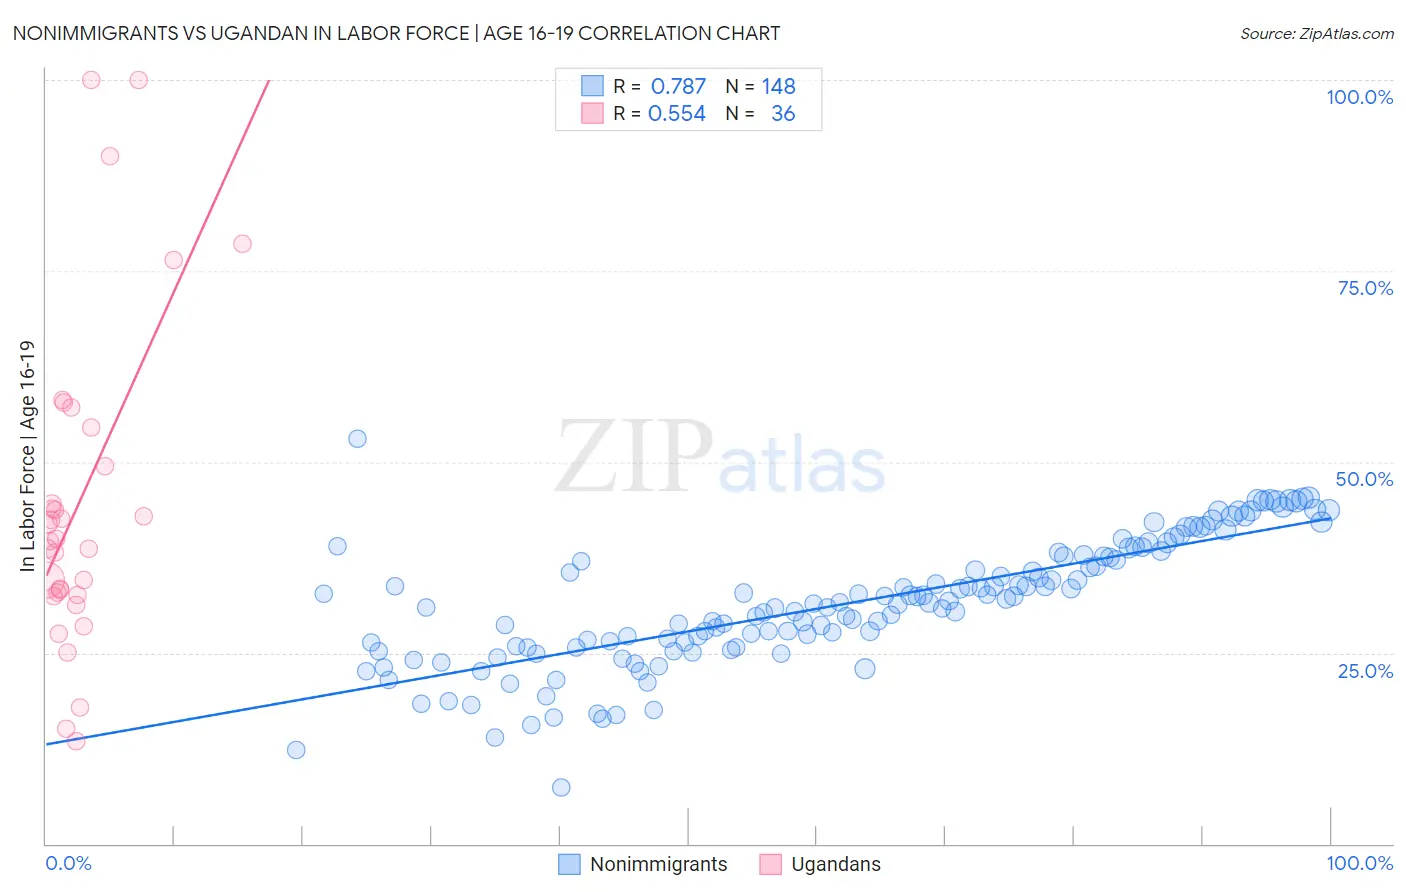
Nonimmigrants vs Ugandan In Labor Force | Age 16-19 Correlation Chart
The statistical analysis conducted on geographies consisting of 578,466,762 people shows a strong positive correlation between the proportion of Nonimmigrants and labor force participation rate among population between the ages 16 and 19 in the United States with a correlation coefficient (R) of 0.787 and weighted average of 40.1%. Similarly, the statistical analysis conducted on geographies consisting of 94,006,992 people shows a substantial positive correlation between the proportion of Ugandans and labor force participation rate among population between the ages 16 and 19 in the United States with a correlation coefficient (R) of 0.554 and weighted average of 38.9%, a difference of 3.2%.
In Labor Force | Age 16-19 Correlation Summary
| Measurement | Nonimmigrants | Ugandan |
| Minimum | 7.3% | 13.5% |
| Maximum | 53.1% | 100.0% |
| Range | 45.8% | 86.5% |
| Mean | 31.6% | 44.8% |
| Median | 31.6% | 39.8% |
| Interquartile 25% (IQ1) | 25.8% | 32.7% |
| Interquartile 75% (IQ3) | 37.7% | 52.0% |
| Interquartile Range (IQR) | 12.0% | 19.3% |
| Standard Deviation (Sample) | 8.3% | 21.2% |
| Standard Deviation (Population) | 8.3% | 20.9% |
Similar Demographics by In Labor Force | Age 16-19
Demographics Similar to Nonimmigrants by In Labor Force | Age 16-19
In terms of in labor force | age 16-19, the demographic groups most similar to Nonimmigrants are Canadian (40.1%, a difference of 0.010%), Italian (40.1%, a difference of 0.070%), Kenyan (40.1%, a difference of 0.12%), Potawatomi (40.0%, a difference of 0.14%), and Portuguese (40.0%, a difference of 0.19%).
| Demographics | Rating | Rank | In Labor Force | Age 16-19 |
| Slavs | 100.0 /100 | #59 | Exceptional 40.4% |
| Immigrants | Eastern Africa | 100.0 /100 | #60 | Exceptional 40.4% |
| Americans | 100.0 /100 | #61 | Exceptional 40.3% |
| Cherokee | 100.0 /100 | #62 | Exceptional 40.2% |
| Northern Europeans | 100.0 /100 | #63 | Exceptional 40.2% |
| Immigrants | Micronesia | 100.0 /100 | #64 | Exceptional 40.2% |
| Kenyans | 100.0 /100 | #65 | Exceptional 40.1% |
| Immigrants | Nonimmigrants | 100.0 /100 | #66 | Exceptional 40.1% |
| Canadians | 100.0 /100 | #67 | Exceptional 40.1% |
| Italians | 99.9 /100 | #68 | Exceptional 40.1% |
| Potawatomi | 99.9 /100 | #69 | Exceptional 40.0% |
| Portuguese | 99.9 /100 | #70 | Exceptional 40.0% |
| Serbians | 99.9 /100 | #71 | Exceptional 39.9% |
| Iroquois | 99.9 /100 | #72 | Exceptional 39.9% |
| Immigrants | Middle Africa | 99.9 /100 | #73 | Exceptional 39.9% |
Demographics Similar to Ugandans by In Labor Force | Age 16-19
In terms of in labor force | age 16-19, the demographic groups most similar to Ugandans are Greek (38.9%, a difference of 0.010%), Immigrants from North Macedonia (38.9%, a difference of 0.020%), Latvian (38.9%, a difference of 0.050%), Immigrants from North America (38.9%, a difference of 0.080%), and Blackfeet (38.9%, a difference of 0.17%).
| Demographics | Rating | Rank | In Labor Force | Age 16-19 |
| Spanish Americans | 99.5 /100 | #91 | Exceptional 39.0% |
| Osage | 99.4 /100 | #92 | Exceptional 39.0% |
| Blackfeet | 99.4 /100 | #93 | Exceptional 38.9% |
| Immigrants | Canada | 99.4 /100 | #94 | Exceptional 38.9% |
| Immigrants | North America | 99.4 /100 | #95 | Exceptional 38.9% |
| Latvians | 99.4 /100 | #96 | Exceptional 38.9% |
| Greeks | 99.3 /100 | #97 | Exceptional 38.9% |
| Ugandans | 99.3 /100 | #98 | Exceptional 38.9% |
| Immigrants | North Macedonia | 99.3 /100 | #99 | Exceptional 38.9% |
| Immigrants | Thailand | 99.1 /100 | #100 | Exceptional 38.7% |
| Hmong | 99.1 /100 | #101 | Exceptional 38.7% |
| Zimbabweans | 99.1 /100 | #102 | Exceptional 38.7% |
| Immigrants | Cameroon | 99.0 /100 | #103 | Exceptional 38.7% |
| Immigrants | Eritrea | 99.0 /100 | #104 | Exceptional 38.7% |
| Iraqis | 98.9 /100 | #105 | Exceptional 38.6% |