Nonimmigrants vs Immigrants from South America In Labor Force | Age 16-19
COMPARE
Nonimmigrants
Immigrants from South America
In Labor Force | Age 16-19
In Labor Force | Age 16-19 Comparison
Nonimmigrants
Immigrants from South America
40.1%
IN LABOR FORCE | AGE 16-19
100.0/ 100
METRIC RATING
66th/ 347
METRIC RANK
33.3%
IN LABOR FORCE | AGE 16-19
0.1/ 100
METRIC RATING
293rd/ 347
METRIC RANK
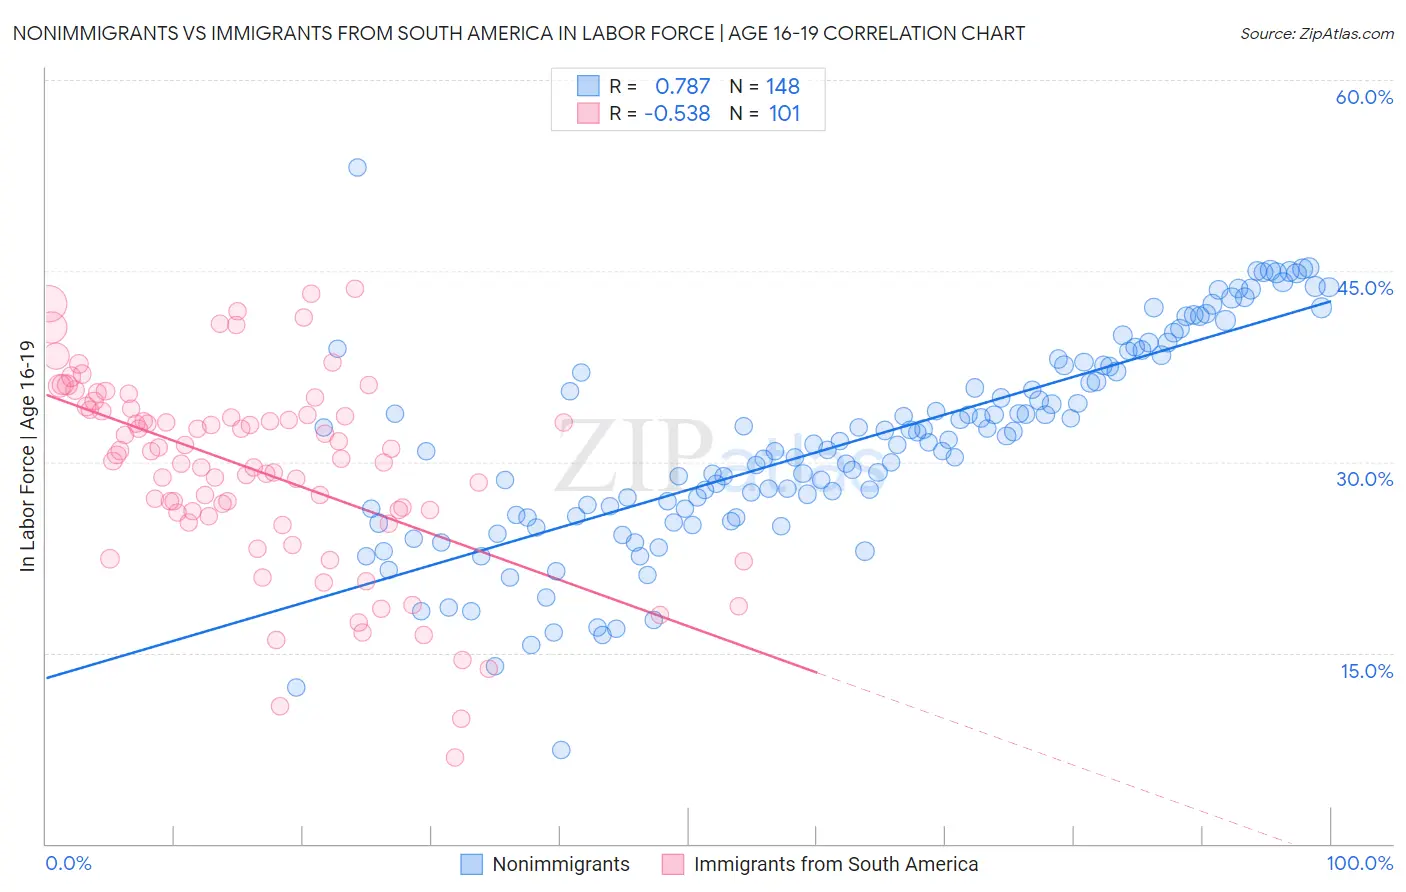
Nonimmigrants vs Immigrants from South America In Labor Force | Age 16-19 Correlation Chart
The statistical analysis conducted on geographies consisting of 578,466,762 people shows a strong positive correlation between the proportion of Nonimmigrants and labor force participation rate among population between the ages 16 and 19 in the United States with a correlation coefficient (R) of 0.787 and weighted average of 40.1%. Similarly, the statistical analysis conducted on geographies consisting of 485,146,560 people shows a substantial negative correlation between the proportion of Immigrants from South America and labor force participation rate among population between the ages 16 and 19 in the United States with a correlation coefficient (R) of -0.538 and weighted average of 33.3%, a difference of 20.4%.
In Labor Force | Age 16-19 Correlation Summary
| Measurement | Nonimmigrants | Immigrants from South America |
| Minimum | 7.3% | 6.8% |
| Maximum | 53.1% | 43.6% |
| Range | 45.8% | 36.8% |
| Mean | 31.6% | 29.4% |
| Median | 31.6% | 30.6% |
| Interquartile 25% (IQ1) | 25.8% | 25.9% |
| Interquartile 75% (IQ3) | 37.7% | 34.2% |
| Interquartile Range (IQR) | 12.0% | 8.3% |
| Standard Deviation (Sample) | 8.3% | 7.6% |
| Standard Deviation (Population) | 8.3% | 7.5% |
Similar Demographics by In Labor Force | Age 16-19
Demographics Similar to Nonimmigrants by In Labor Force | Age 16-19
In terms of in labor force | age 16-19, the demographic groups most similar to Nonimmigrants are Canadian (40.1%, a difference of 0.010%), Italian (40.1%, a difference of 0.070%), Kenyan (40.1%, a difference of 0.12%), Potawatomi (40.0%, a difference of 0.14%), and Portuguese (40.0%, a difference of 0.19%).
| Demographics | Rating | Rank | In Labor Force | Age 16-19 |
| Slavs | 100.0 /100 | #59 | Exceptional 40.4% |
| Immigrants | Eastern Africa | 100.0 /100 | #60 | Exceptional 40.4% |
| Americans | 100.0 /100 | #61 | Exceptional 40.3% |
| Cherokee | 100.0 /100 | #62 | Exceptional 40.2% |
| Northern Europeans | 100.0 /100 | #63 | Exceptional 40.2% |
| Immigrants | Micronesia | 100.0 /100 | #64 | Exceptional 40.2% |
| Kenyans | 100.0 /100 | #65 | Exceptional 40.1% |
| Immigrants | Nonimmigrants | 100.0 /100 | #66 | Exceptional 40.1% |
| Canadians | 100.0 /100 | #67 | Exceptional 40.1% |
| Italians | 99.9 /100 | #68 | Exceptional 40.1% |
| Potawatomi | 99.9 /100 | #69 | Exceptional 40.0% |
| Portuguese | 99.9 /100 | #70 | Exceptional 40.0% |
| Serbians | 99.9 /100 | #71 | Exceptional 39.9% |
| Iroquois | 99.9 /100 | #72 | Exceptional 39.9% |
| Immigrants | Middle Africa | 99.9 /100 | #73 | Exceptional 39.9% |
Demographics Similar to Immigrants from South America by In Labor Force | Age 16-19
In terms of in labor force | age 16-19, the demographic groups most similar to Immigrants from South America are Argentinean (33.3%, a difference of 0.020%), Yup'ik (33.3%, a difference of 0.12%), Jamaican (33.2%, a difference of 0.25%), Haitian (33.4%, a difference of 0.32%), and Immigrants from Haiti (33.2%, a difference of 0.34%).
| Demographics | Rating | Rank | In Labor Force | Age 16-19 |
| South Americans | 0.2 /100 | #286 | Tragic 33.6% |
| Nepalese | 0.1 /100 | #287 | Tragic 33.5% |
| Immigrants | Indonesia | 0.1 /100 | #288 | Tragic 33.5% |
| Immigrants | Singapore | 0.1 /100 | #289 | Tragic 33.5% |
| Immigrants | Colombia | 0.1 /100 | #290 | Tragic 33.5% |
| Immigrants | Belarus | 0.1 /100 | #291 | Tragic 33.4% |
| Haitians | 0.1 /100 | #292 | Tragic 33.4% |
| Immigrants | South America | 0.1 /100 | #293 | Tragic 33.3% |
| Argentineans | 0.1 /100 | #294 | Tragic 33.3% |
| Yup'ik | 0.1 /100 | #295 | Tragic 33.3% |
| Jamaicans | 0.1 /100 | #296 | Tragic 33.2% |
| Immigrants | Haiti | 0.1 /100 | #297 | Tragic 33.2% |
| Iranians | 0.0 /100 | #298 | Tragic 33.0% |
| Armenians | 0.0 /100 | #299 | Tragic 32.9% |
| Immigrants | Argentina | 0.0 /100 | #300 | Tragic 32.9% |