Immigrants from Uruguay vs West Indian In Labor Force | Age 20-64
COMPARE
Immigrants from Uruguay
West Indian
In Labor Force | Age 20-64
In Labor Force | Age 20-64 Comparison
Immigrants from Uruguay
West Indians
80.1%
IN LABOR FORCE | AGE 20-64
95.8/ 100
METRIC RATING
98th/ 347
METRIC RANK
78.3%
IN LABOR FORCE | AGE 20-64
0.0/ 100
METRIC RATING
268th/ 347
METRIC RANK
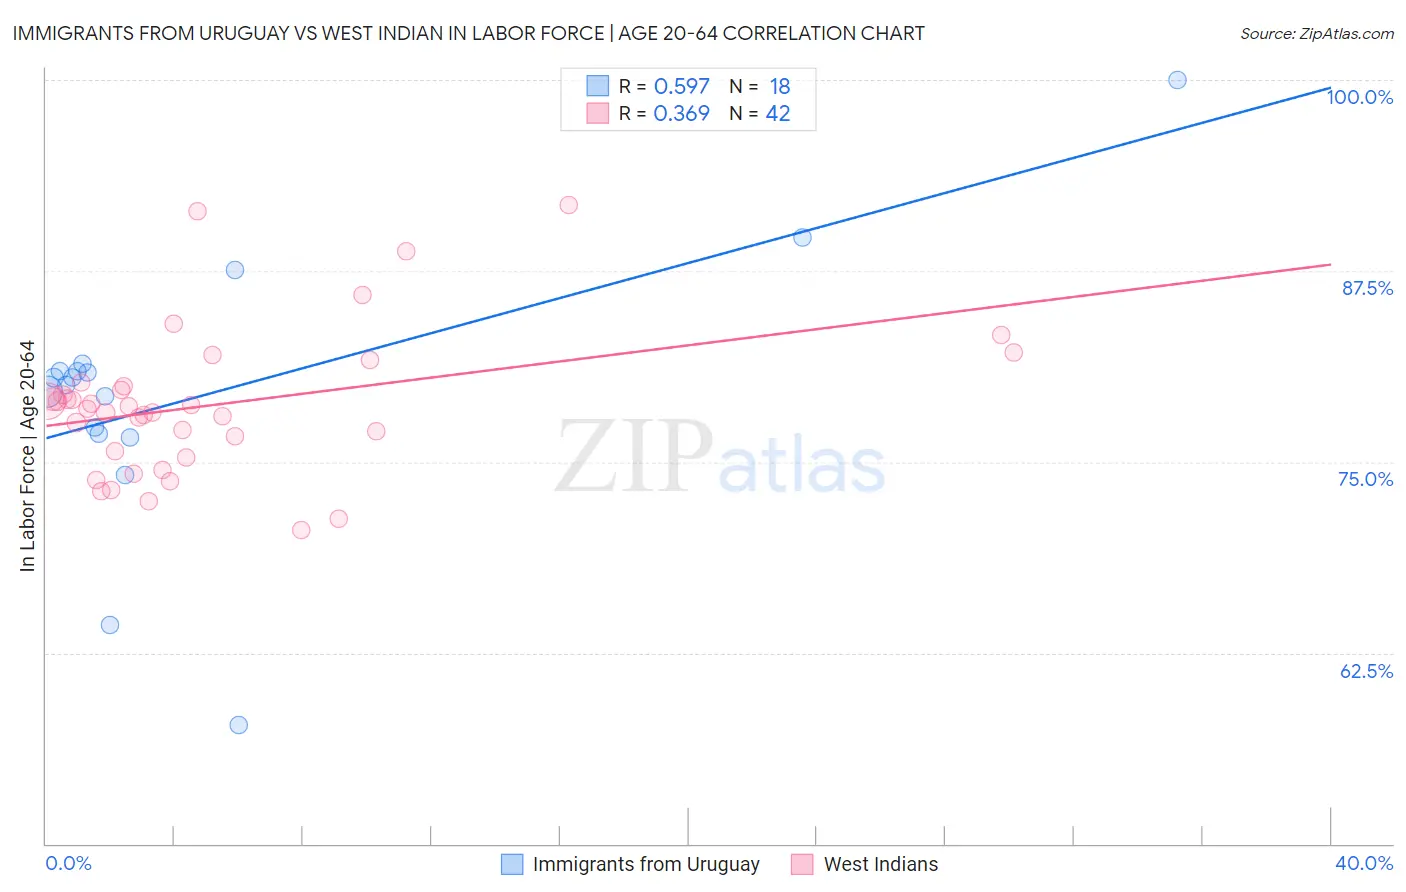
Immigrants from Uruguay vs West Indian In Labor Force | Age 20-64 Correlation Chart
The statistical analysis conducted on geographies consisting of 133,256,636 people shows a substantial positive correlation between the proportion of Immigrants from Uruguay and labor force participation rate among population between the ages 20 and 64 in the United States with a correlation coefficient (R) of 0.597 and weighted average of 80.1%. Similarly, the statistical analysis conducted on geographies consisting of 254,049,696 people shows a mild positive correlation between the proportion of West Indians and labor force participation rate among population between the ages 20 and 64 in the United States with a correlation coefficient (R) of 0.369 and weighted average of 78.3%, a difference of 2.2%.
In Labor Force | Age 20-64 Correlation Summary
| Measurement | Immigrants from Uruguay | West Indian |
| Minimum | 57.8% | 70.5% |
| Maximum | 100.0% | 91.8% |
| Range | 42.2% | 21.3% |
| Mean | 79.4% | 78.7% |
| Median | 80.3% | 78.6% |
| Interquartile 25% (IQ1) | 76.9% | 75.7% |
| Interquartile 75% (IQ3) | 81.0% | 80.0% |
| Interquartile Range (IQR) | 4.1% | 4.3% |
| Standard Deviation (Sample) | 8.9% | 4.7% |
| Standard Deviation (Population) | 8.7% | 4.7% |
Similar Demographics by In Labor Force | Age 20-64
Demographics Similar to Immigrants from Uruguay by In Labor Force | Age 20-64
In terms of in labor force | age 20-64, the demographic groups most similar to Immigrants from Uruguay are Yugoslavian (80.1%, a difference of 0.0%), Immigrants from Malaysia (80.1%, a difference of 0.0%), South American (80.1%, a difference of 0.0%), Immigrants from Asia (80.1%, a difference of 0.010%), and Immigrants from Chile (80.1%, a difference of 0.010%).
| Demographics | Rating | Rank | In Labor Force | Age 20-64 |
| Uruguayans | 96.7 /100 | #91 | Exceptional 80.1% |
| Ghanaians | 96.7 /100 | #92 | Exceptional 80.1% |
| Immigrants | Belarus | 96.4 /100 | #93 | Exceptional 80.1% |
| Immigrants | Asia | 96.0 /100 | #94 | Exceptional 80.1% |
| Yugoslavians | 95.9 /100 | #95 | Exceptional 80.1% |
| Immigrants | Malaysia | 95.9 /100 | #96 | Exceptional 80.1% |
| South Americans | 95.9 /100 | #97 | Exceptional 80.1% |
| Immigrants | Uruguay | 95.8 /100 | #98 | Exceptional 80.1% |
| Immigrants | Chile | 95.7 /100 | #99 | Exceptional 80.1% |
| Filipinos | 95.6 /100 | #100 | Exceptional 80.1% |
| Palestinians | 95.5 /100 | #101 | Exceptional 80.0% |
| Immigrants | Australia | 95.5 /100 | #102 | Exceptional 80.0% |
| Russians | 95.5 /100 | #103 | Exceptional 80.0% |
| Venezuelans | 95.3 /100 | #104 | Exceptional 80.0% |
| Immigrants | Ghana | 95.0 /100 | #105 | Exceptional 80.0% |
Demographics Similar to West Indians by In Labor Force | Age 20-64
In terms of in labor force | age 20-64, the demographic groups most similar to West Indians are U.S. Virgin Islander (78.4%, a difference of 0.020%), Bahamian (78.4%, a difference of 0.040%), British West Indian (78.4%, a difference of 0.050%), Immigrants from Barbados (78.3%, a difference of 0.050%), and Scotch-Irish (78.3%, a difference of 0.080%).
| Demographics | Rating | Rank | In Labor Force | Age 20-64 |
| Whites/Caucasians | 0.2 /100 | #261 | Tragic 78.5% |
| Fijians | 0.1 /100 | #262 | Tragic 78.4% |
| Pennsylvania Germans | 0.1 /100 | #263 | Tragic 78.4% |
| Spaniards | 0.1 /100 | #264 | Tragic 78.4% |
| British West Indians | 0.1 /100 | #265 | Tragic 78.4% |
| Bahamians | 0.1 /100 | #266 | Tragic 78.4% |
| U.S. Virgin Islanders | 0.1 /100 | #267 | Tragic 78.4% |
| West Indians | 0.0 /100 | #268 | Tragic 78.3% |
| Immigrants | Barbados | 0.0 /100 | #269 | Tragic 78.3% |
| Scotch-Irish | 0.0 /100 | #270 | Tragic 78.3% |
| Immigrants | Latin America | 0.0 /100 | #271 | Tragic 78.3% |
| Marshallese | 0.0 /100 | #272 | Tragic 78.3% |
| French American Indians | 0.0 /100 | #273 | Tragic 78.2% |
| Aleuts | 0.0 /100 | #274 | Tragic 78.2% |
| Spanish | 0.0 /100 | #275 | Tragic 78.2% |