Estonian vs Asian In Labor Force | Age 20-24
COMPARE
Estonian
Asian
In Labor Force | Age 20-24
In Labor Force | Age 20-24 Comparison
Estonians
Asians
75.6%
IN LABOR FORCE | AGE 20-24
87.1/ 100
METRIC RATING
134th/ 347
METRIC RANK
73.7%
IN LABOR FORCE | AGE 20-24
0.6/ 100
METRIC RATING
262nd/ 347
METRIC RANK
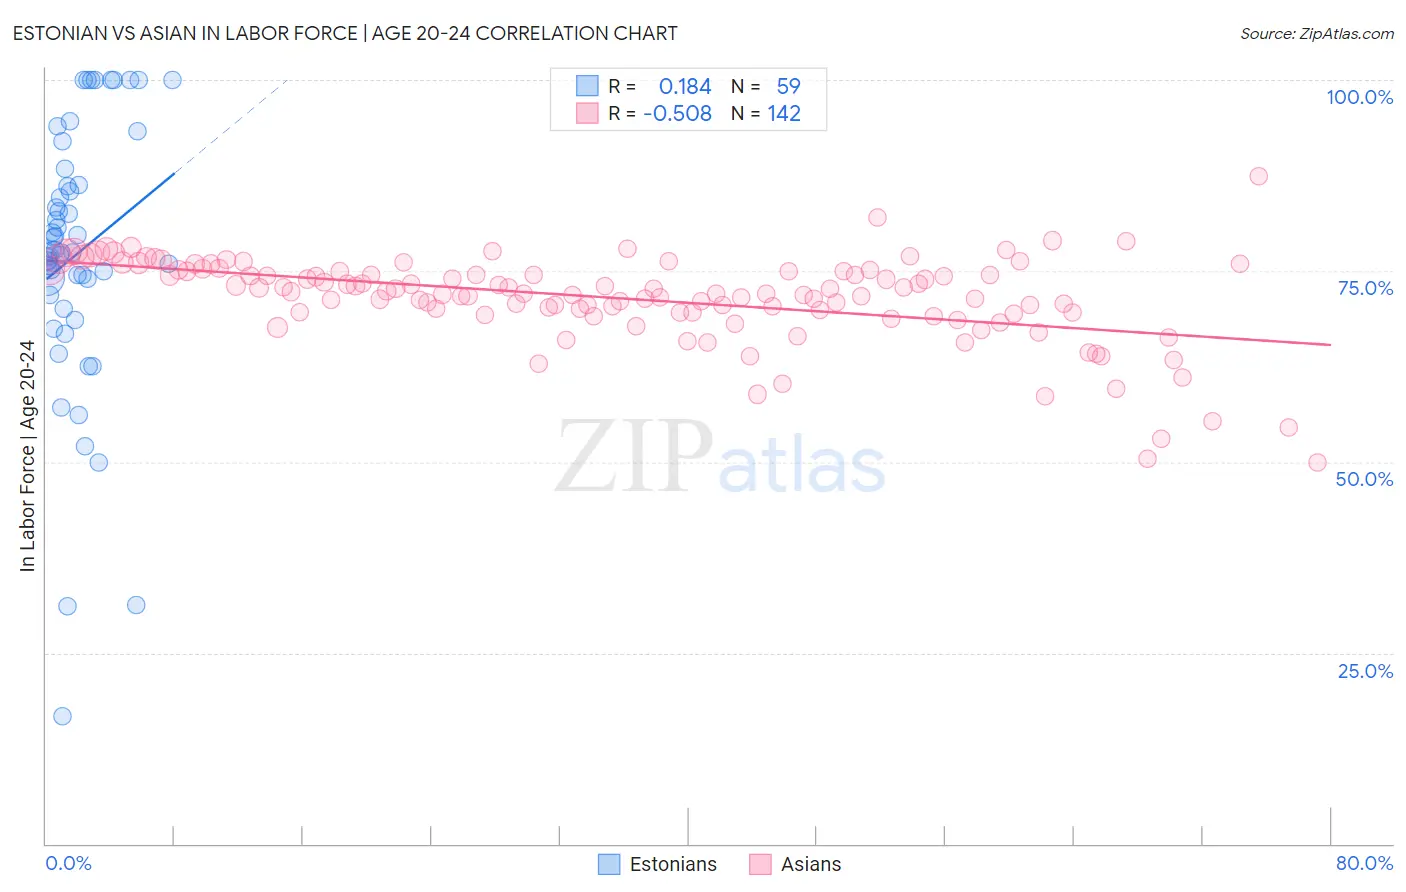
Estonian vs Asian In Labor Force | Age 20-24 Correlation Chart
The statistical analysis conducted on geographies consisting of 123,512,369 people shows a poor positive correlation between the proportion of Estonians and labor force participation rate among population between the ages 20 and 24 in the United States with a correlation coefficient (R) of 0.184 and weighted average of 75.6%. Similarly, the statistical analysis conducted on geographies consisting of 550,133,800 people shows a substantial negative correlation between the proportion of Asians and labor force participation rate among population between the ages 20 and 24 in the United States with a correlation coefficient (R) of -0.508 and weighted average of 73.7%, a difference of 2.6%.
In Labor Force | Age 20-24 Correlation Summary
| Measurement | Estonian | Asian |
| Minimum | 16.7% | 50.0% |
| Maximum | 100.0% | 87.4% |
| Range | 83.3% | 37.4% |
| Mean | 77.2% | 71.4% |
| Median | 77.5% | 72.2% |
| Interquartile 25% (IQ1) | 71.9% | 69.5% |
| Interquartile 75% (IQ3) | 86.3% | 75.0% |
| Interquartile Range (IQR) | 14.4% | 5.5% |
| Standard Deviation (Sample) | 17.3% | 5.8% |
| Standard Deviation (Population) | 17.2% | 5.8% |
Similar Demographics by In Labor Force | Age 20-24
Demographics Similar to Estonians by In Labor Force | Age 20-24
In terms of in labor force | age 20-24, the demographic groups most similar to Estonians are Zimbabwean (75.6%, a difference of 0.040%), Immigrants from Jordan (75.6%, a difference of 0.050%), Palestinian (75.6%, a difference of 0.050%), Yaqui (75.5%, a difference of 0.050%), and Immigrants from Austria (75.6%, a difference of 0.060%).
| Demographics | Rating | Rank | In Labor Force | Age 20-24 |
| Sub-Saharan Africans | 90.9 /100 | #127 | Exceptional 75.7% |
| Immigrants | Afghanistan | 89.4 /100 | #128 | Excellent 75.6% |
| Iroquois | 89.1 /100 | #129 | Excellent 75.6% |
| Immigrants | Austria | 88.8 /100 | #130 | Excellent 75.6% |
| Immigrants | Jordan | 88.5 /100 | #131 | Excellent 75.6% |
| Palestinians | 88.4 /100 | #132 | Excellent 75.6% |
| Zimbabweans | 88.2 /100 | #133 | Excellent 75.6% |
| Estonians | 87.1 /100 | #134 | Excellent 75.6% |
| Yaqui | 85.5 /100 | #135 | Excellent 75.5% |
| Immigrants | Brazil | 84.8 /100 | #136 | Excellent 75.5% |
| Jordanians | 84.8 /100 | #137 | Excellent 75.5% |
| Australians | 84.8 /100 | #138 | Excellent 75.5% |
| Immigrants | England | 84.6 /100 | #139 | Excellent 75.5% |
| Delaware | 84.5 /100 | #140 | Excellent 75.5% |
| Romanians | 84.1 /100 | #141 | Excellent 75.5% |
Demographics Similar to Asians by In Labor Force | Age 20-24
In terms of in labor force | age 20-24, the demographic groups most similar to Asians are Houma (73.7%, a difference of 0.010%), Immigrants from Turkey (73.7%, a difference of 0.020%), Egyptian (73.7%, a difference of 0.050%), Dutch West Indian (73.7%, a difference of 0.050%), and Immigrants from Asia (73.6%, a difference of 0.080%).
| Demographics | Rating | Rank | In Labor Force | Age 20-24 |
| Immigrants | Pakistan | 0.9 /100 | #255 | Tragic 73.8% |
| Spanish American Indians | 0.8 /100 | #256 | Tragic 73.7% |
| Paraguayans | 0.8 /100 | #257 | Tragic 73.7% |
| Egyptians | 0.7 /100 | #258 | Tragic 73.7% |
| Dutch West Indians | 0.7 /100 | #259 | Tragic 73.7% |
| Immigrants | Turkey | 0.7 /100 | #260 | Tragic 73.7% |
| Houma | 0.6 /100 | #261 | Tragic 73.7% |
| Asians | 0.6 /100 | #262 | Tragic 73.7% |
| Immigrants | Asia | 0.5 /100 | #263 | Tragic 73.6% |
| Immigrants | Haiti | 0.5 /100 | #264 | Tragic 73.6% |
| Burmese | 0.5 /100 | #265 | Tragic 73.6% |
| Haitians | 0.5 /100 | #266 | Tragic 73.6% |
| Immigrants | Western Asia | 0.4 /100 | #267 | Tragic 73.5% |
| South Americans | 0.4 /100 | #268 | Tragic 73.5% |
| Colombians | 0.3 /100 | #269 | Tragic 73.5% |