Immigrants from Uganda vs Immigrants from Jordan In Labor Force | Age 35-44
COMPARE
Immigrants from Uganda
Immigrants from Jordan
In Labor Force | Age 35-44
In Labor Force | Age 35-44 Comparison
Immigrants from Uganda
Immigrants from Jordan
85.0%
IN LABOR FORCE | AGE 35-44
99.3/ 100
METRIC RATING
63rd/ 347
METRIC RANK
84.4%
IN LABOR FORCE | AGE 35-44
52.5/ 100
METRIC RATING
170th/ 347
METRIC RANK
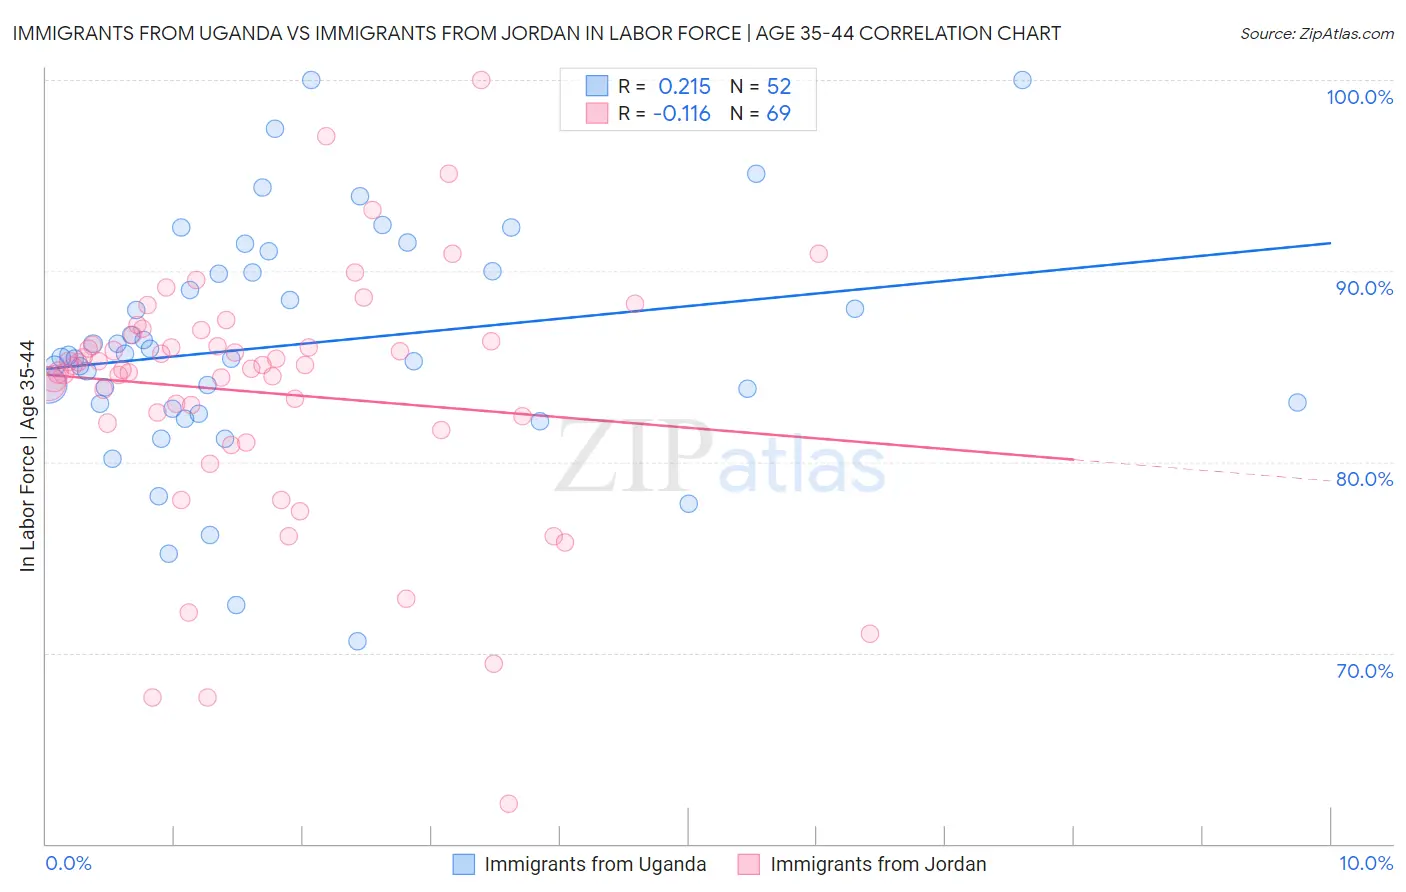
Immigrants from Uganda vs Immigrants from Jordan In Labor Force | Age 35-44 Correlation Chart
The statistical analysis conducted on geographies consisting of 125,971,479 people shows a weak positive correlation between the proportion of Immigrants from Uganda and labor force participation rate among population between the ages 35 and 44 in the United States with a correlation coefficient (R) of 0.215 and weighted average of 85.0%. Similarly, the statistical analysis conducted on geographies consisting of 181,251,631 people shows a poor negative correlation between the proportion of Immigrants from Jordan and labor force participation rate among population between the ages 35 and 44 in the United States with a correlation coefficient (R) of -0.116 and weighted average of 84.4%, a difference of 0.78%.
In Labor Force | Age 35-44 Correlation Summary
| Measurement | Immigrants from Uganda | Immigrants from Jordan |
| Minimum | 70.6% | 62.1% |
| Maximum | 100.0% | 100.0% |
| Range | 29.4% | 37.9% |
| Mean | 86.1% | 83.6% |
| Median | 85.5% | 85.0% |
| Interquartile 25% (IQ1) | 82.9% | 81.9% |
| Interquartile 75% (IQ3) | 90.0% | 86.5% |
| Interquartile Range (IQR) | 7.0% | 4.6% |
| Standard Deviation (Sample) | 6.2% | 6.6% |
| Standard Deviation (Population) | 6.1% | 6.6% |
Similar Demographics by In Labor Force | Age 35-44
Demographics Similar to Immigrants from Uganda by In Labor Force | Age 35-44
In terms of in labor force | age 35-44, the demographic groups most similar to Immigrants from Uganda are Immigrants from Moldova (85.0%, a difference of 0.0%), Immigrants from Latvia (85.0%, a difference of 0.010%), Swedish (85.0%, a difference of 0.010%), Immigrants from Brazil (85.0%, a difference of 0.020%), and Slovak (85.1%, a difference of 0.030%).
| Demographics | Rating | Rank | In Labor Force | Age 35-44 |
| Immigrants | Croatia | 99.5 /100 | #56 | Exceptional 85.1% |
| Chinese | 99.4 /100 | #57 | Exceptional 85.1% |
| Slovaks | 99.4 /100 | #58 | Exceptional 85.1% |
| Serbians | 99.4 /100 | #59 | Exceptional 85.1% |
| Albanians | 99.4 /100 | #60 | Exceptional 85.1% |
| Immigrants | Latvia | 99.3 /100 | #61 | Exceptional 85.0% |
| Immigrants | Moldova | 99.3 /100 | #62 | Exceptional 85.0% |
| Immigrants | Uganda | 99.3 /100 | #63 | Exceptional 85.0% |
| Swedes | 99.2 /100 | #64 | Exceptional 85.0% |
| Immigrants | Brazil | 99.2 /100 | #65 | Exceptional 85.0% |
| Immigrants | Haiti | 99.1 /100 | #66 | Exceptional 85.0% |
| Immigrants | Italy | 99.1 /100 | #67 | Exceptional 85.0% |
| Italians | 99.1 /100 | #68 | Exceptional 85.0% |
| Sudanese | 99.0 /100 | #69 | Exceptional 85.0% |
| Brazilians | 99.0 /100 | #70 | Exceptional 85.0% |
Demographics Similar to Immigrants from Jordan by In Labor Force | Age 35-44
In terms of in labor force | age 35-44, the demographic groups most similar to Immigrants from Jordan are Irish (84.4%, a difference of 0.0%), Immigrants from Afghanistan (84.4%, a difference of 0.0%), Jordanian (84.4%, a difference of 0.0%), Scandinavian (84.4%, a difference of 0.010%), and Immigrants from Trinidad and Tobago (84.4%, a difference of 0.010%).
| Demographics | Rating | Rank | In Labor Force | Age 35-44 |
| Aleuts | 59.1 /100 | #163 | Average 84.4% |
| Nigerians | 58.9 /100 | #164 | Average 84.4% |
| Venezuelans | 58.1 /100 | #165 | Average 84.4% |
| Alsatians | 55.2 /100 | #166 | Average 84.4% |
| Immigrants | Portugal | 55.2 /100 | #167 | Average 84.4% |
| Irish | 53.1 /100 | #168 | Average 84.4% |
| Immigrants | Afghanistan | 52.7 /100 | #169 | Average 84.4% |
| Immigrants | Jordan | 52.5 /100 | #170 | Average 84.4% |
| Jordanians | 51.7 /100 | #171 | Average 84.4% |
| Scandinavians | 51.2 /100 | #172 | Average 84.4% |
| Immigrants | Trinidad and Tobago | 50.7 /100 | #173 | Average 84.4% |
| Immigrants | Iran | 50.0 /100 | #174 | Average 84.4% |
| Pakistanis | 48.2 /100 | #175 | Average 84.4% |
| Sri Lankans | 47.3 /100 | #176 | Average 84.4% |
| French Canadians | 44.3 /100 | #177 | Average 84.3% |