Immigrants from Trinidad and Tobago vs Cajun In Labor Force | Age 35-44
COMPARE
Immigrants from Trinidad and Tobago
Cajun
In Labor Force | Age 35-44
In Labor Force | Age 35-44 Comparison
Immigrants from Trinidad and Tobago
Cajuns
84.4%
IN LABOR FORCE | AGE 35-44
50.7/ 100
METRIC RATING
173rd/ 347
METRIC RANK
81.5%
IN LABOR FORCE | AGE 35-44
0.0/ 100
METRIC RATING
314th/ 347
METRIC RANK
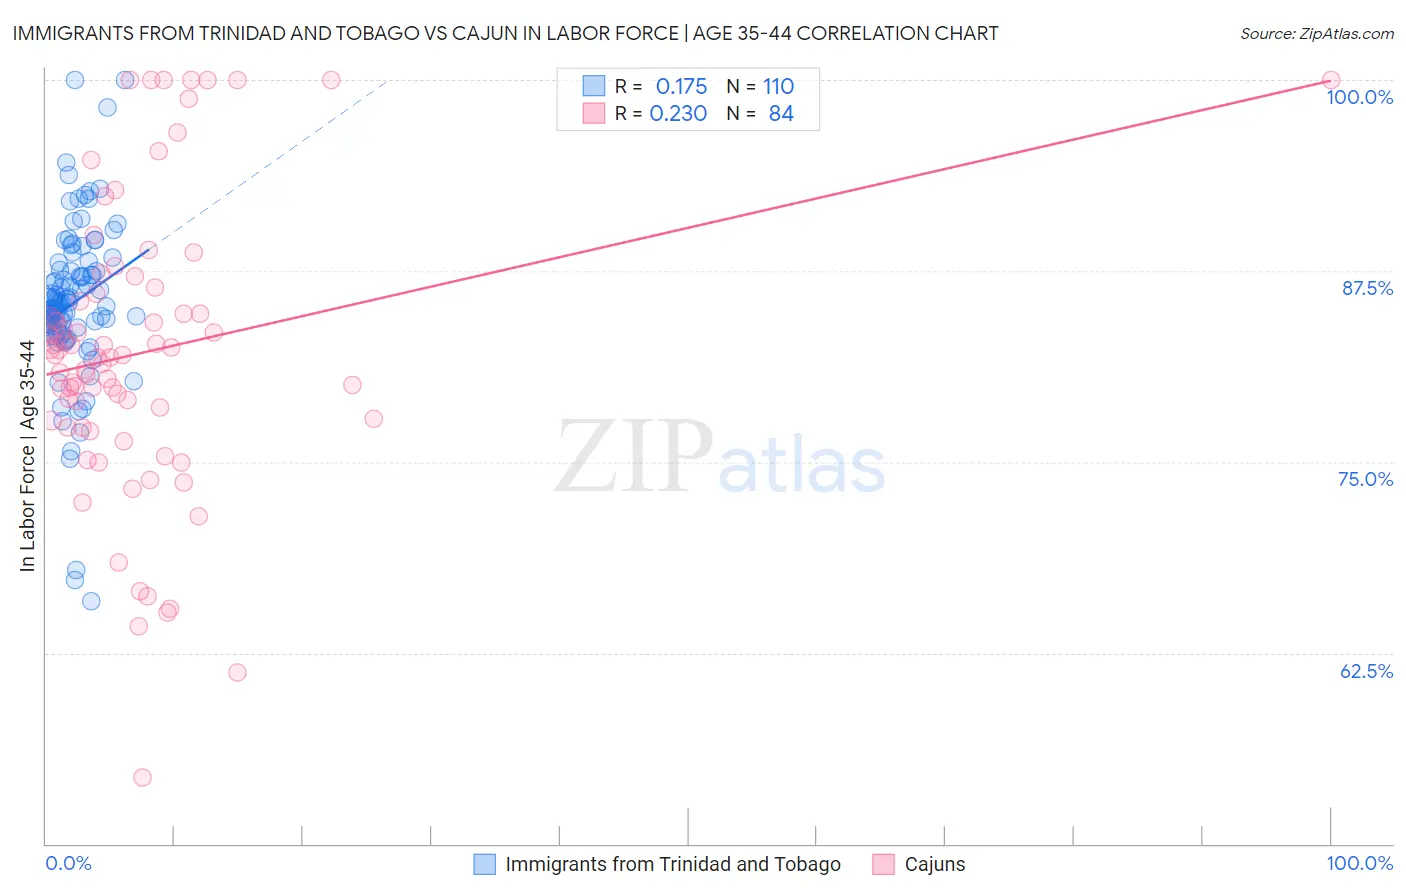
Immigrants from Trinidad and Tobago vs Cajun In Labor Force | Age 35-44 Correlation Chart
The statistical analysis conducted on geographies consisting of 223,496,330 people shows a poor positive correlation between the proportion of Immigrants from Trinidad and Tobago and labor force participation rate among population between the ages 35 and 44 in the United States with a correlation coefficient (R) of 0.175 and weighted average of 84.4%. Similarly, the statistical analysis conducted on geographies consisting of 149,699,850 people shows a weak positive correlation between the proportion of Cajuns and labor force participation rate among population between the ages 35 and 44 in the United States with a correlation coefficient (R) of 0.230 and weighted average of 81.5%, a difference of 3.5%.
In Labor Force | Age 35-44 Correlation Summary
| Measurement | Immigrants from Trinidad and Tobago | Cajun |
| Minimum | 65.9% | 54.3% |
| Maximum | 100.0% | 100.0% |
| Range | 34.1% | 45.7% |
| Mean | 85.4% | 82.2% |
| Median | 85.2% | 81.9% |
| Interquartile 25% (IQ1) | 83.8% | 77.5% |
| Interquartile 75% (IQ3) | 87.5% | 86.2% |
| Interquartile Range (IQR) | 3.7% | 8.7% |
| Standard Deviation (Sample) | 5.3% | 9.5% |
| Standard Deviation (Population) | 5.3% | 9.5% |
Similar Demographics by In Labor Force | Age 35-44
Demographics Similar to Immigrants from Trinidad and Tobago by In Labor Force | Age 35-44
In terms of in labor force | age 35-44, the demographic groups most similar to Immigrants from Trinidad and Tobago are Scandinavian (84.4%, a difference of 0.0%), Immigrants from Iran (84.4%, a difference of 0.0%), Immigrants from Afghanistan (84.4%, a difference of 0.010%), Immigrants from Jordan (84.4%, a difference of 0.010%), and Jordanian (84.4%, a difference of 0.010%).
| Demographics | Rating | Rank | In Labor Force | Age 35-44 |
| Alsatians | 55.2 /100 | #166 | Average 84.4% |
| Immigrants | Portugal | 55.2 /100 | #167 | Average 84.4% |
| Irish | 53.1 /100 | #168 | Average 84.4% |
| Immigrants | Afghanistan | 52.7 /100 | #169 | Average 84.4% |
| Immigrants | Jordan | 52.5 /100 | #170 | Average 84.4% |
| Jordanians | 51.7 /100 | #171 | Average 84.4% |
| Scandinavians | 51.2 /100 | #172 | Average 84.4% |
| Immigrants | Trinidad and Tobago | 50.7 /100 | #173 | Average 84.4% |
| Immigrants | Iran | 50.0 /100 | #174 | Average 84.4% |
| Pakistanis | 48.2 /100 | #175 | Average 84.4% |
| Sri Lankans | 47.3 /100 | #176 | Average 84.4% |
| French Canadians | 44.3 /100 | #177 | Average 84.3% |
| Northern Europeans | 44.1 /100 | #178 | Average 84.3% |
| Immigrants | South Africa | 42.8 /100 | #179 | Average 84.3% |
| Danes | 38.8 /100 | #180 | Fair 84.3% |
Demographics Similar to Cajuns by In Labor Force | Age 35-44
In terms of in labor force | age 35-44, the demographic groups most similar to Cajuns are Immigrants from Mexico (81.5%, a difference of 0.020%), Comanche (81.5%, a difference of 0.050%), Mexican (81.6%, a difference of 0.11%), Alaska Native (81.6%, a difference of 0.12%), and Cherokee (81.4%, a difference of 0.13%).
| Demographics | Rating | Rank | In Labor Force | Age 35-44 |
| Hispanics or Latinos | 0.0 /100 | #307 | Tragic 82.1% |
| Immigrants | Central America | 0.0 /100 | #308 | Tragic 82.0% |
| Cree | 0.0 /100 | #309 | Tragic 82.0% |
| Blackfeet | 0.0 /100 | #310 | Tragic 81.9% |
| Colville | 0.0 /100 | #311 | Tragic 81.7% |
| Alaska Natives | 0.0 /100 | #312 | Tragic 81.6% |
| Mexicans | 0.0 /100 | #313 | Tragic 81.6% |
| Cajuns | 0.0 /100 | #314 | Tragic 81.5% |
| Immigrants | Mexico | 0.0 /100 | #315 | Tragic 81.5% |
| Comanche | 0.0 /100 | #316 | Tragic 81.5% |
| Cherokee | 0.0 /100 | #317 | Tragic 81.4% |
| Alaskan Athabascans | 0.0 /100 | #318 | Tragic 81.3% |
| Inupiat | 0.0 /100 | #319 | Tragic 80.9% |
| Chickasaw | 0.0 /100 | #320 | Tragic 80.9% |
| Puerto Ricans | 0.0 /100 | #321 | Tragic 80.7% |