New Zealander vs Asian In Labor Force | Age 30-34
COMPARE
New Zealander
Asian
In Labor Force | Age 30-34
In Labor Force | Age 30-34 Comparison
New Zealanders
Asians
85.0%
IN LABOR FORCE | AGE 30-34
89.5/ 100
METRIC RATING
133rd/ 347
METRIC RANK
85.1%
IN LABOR FORCE | AGE 30-34
93.4/ 100
METRIC RATING
119th/ 347
METRIC RANK
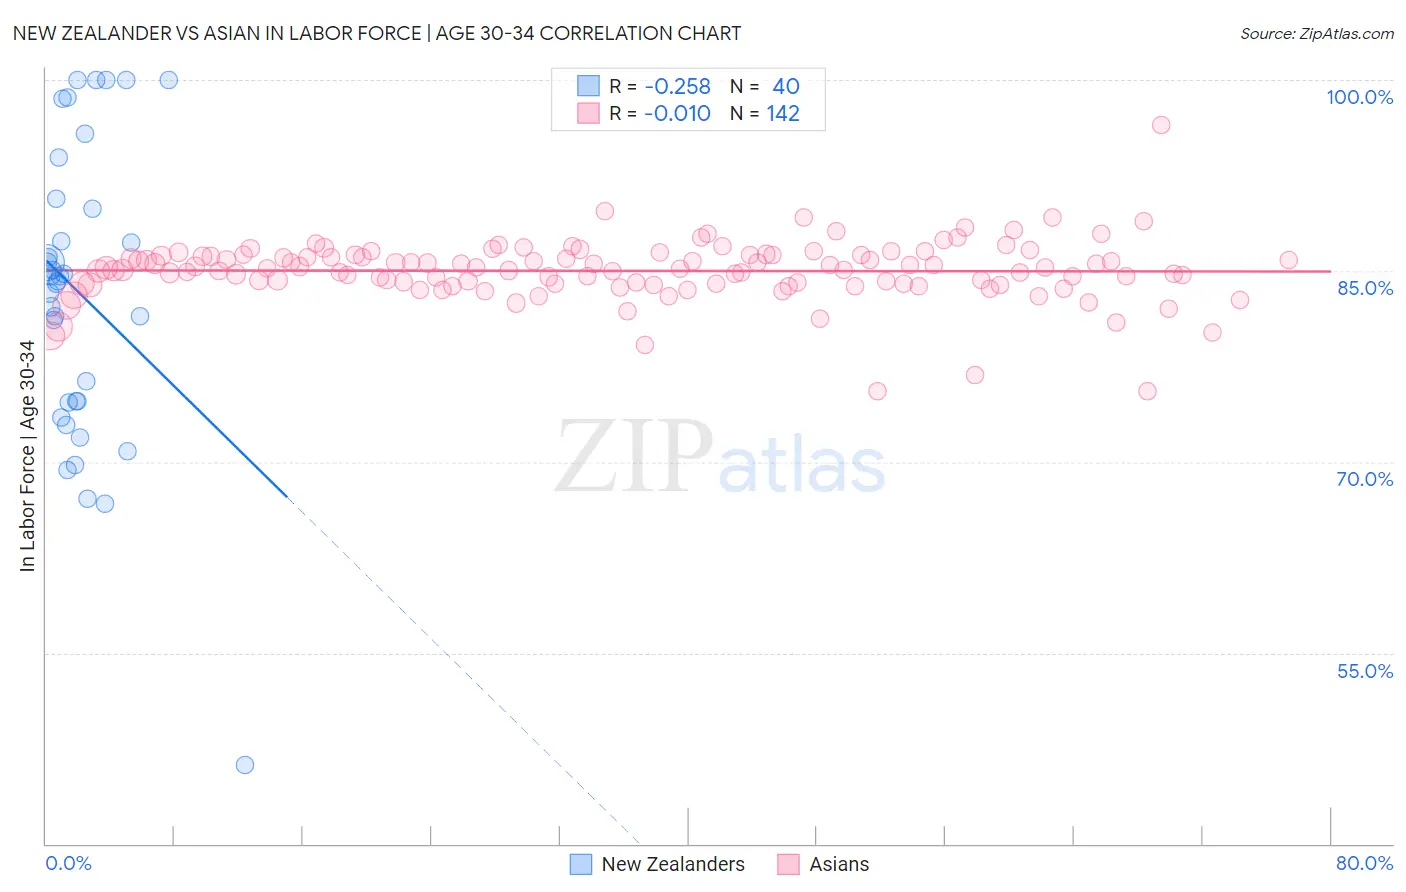
New Zealander vs Asian In Labor Force | Age 30-34 Correlation Chart
The statistical analysis conducted on geographies consisting of 106,910,408 people shows a weak negative correlation between the proportion of New Zealanders and labor force participation rate among population between the ages 30 and 34 in the United States with a correlation coefficient (R) of -0.258 and weighted average of 85.0%. Similarly, the statistical analysis conducted on geographies consisting of 550,086,140 people shows no correlation between the proportion of Asians and labor force participation rate among population between the ages 30 and 34 in the United States with a correlation coefficient (R) of -0.010 and weighted average of 85.1%, a difference of 0.090%.
In Labor Force | Age 30-34 Correlation Summary
| Measurement | New Zealander | Asian |
| Minimum | 46.2% | 75.5% |
| Maximum | 100.0% | 96.5% |
| Range | 53.8% | 21.0% |
| Mean | 83.1% | 85.0% |
| Median | 84.4% | 85.2% |
| Interquartile 25% (IQ1) | 74.7% | 84.0% |
| Interquartile 75% (IQ3) | 90.3% | 86.2% |
| Interquartile Range (IQR) | 15.6% | 2.2% |
| Standard Deviation (Sample) | 11.7% | 2.4% |
| Standard Deviation (Population) | 11.6% | 2.4% |
Demographics Similar to New Zealanders and Asians by In Labor Force | Age 30-34
In terms of in labor force | age 30-34, the demographic groups most similar to New Zealanders are Chinese (85.0%, a difference of 0.0%), Immigrants from Israel (85.0%, a difference of 0.0%), Immigrants from Western Africa (85.0%, a difference of 0.010%), Immigrants from Spain (85.0%, a difference of 0.010%), and Immigrants from Chile (85.0%, a difference of 0.010%). Similarly, the demographic groups most similar to Asians are Immigrants from Southern Europe (85.1%, a difference of 0.0%), Immigrants from Egypt (85.1%, a difference of 0.010%), Immigrants from Malaysia (85.1%, a difference of 0.020%), Immigrants from Kuwait (85.1%, a difference of 0.020%), and Egyptian (85.1%, a difference of 0.030%).
| Demographics | Rating | Rank | In Labor Force | Age 30-34 |
| Egyptians | 94.5 /100 | #116 | Exceptional 85.1% |
| Immigrants | Denmark | 94.3 /100 | #117 | Exceptional 85.1% |
| Immigrants | Malaysia | 94.2 /100 | #118 | Exceptional 85.1% |
| Asians | 93.4 /100 | #119 | Exceptional 85.1% |
| Immigrants | Southern Europe | 93.3 /100 | #120 | Exceptional 85.1% |
| Immigrants | Egypt | 93.2 /100 | #121 | Exceptional 85.1% |
| Immigrants | Kuwait | 92.6 /100 | #122 | Exceptional 85.1% |
| Armenians | 92.2 /100 | #123 | Exceptional 85.0% |
| Australians | 92.0 /100 | #124 | Exceptional 85.0% |
| Immigrants | Jordan | 91.5 /100 | #125 | Exceptional 85.0% |
| Austrians | 90.9 /100 | #126 | Exceptional 85.0% |
| Slavs | 90.7 /100 | #127 | Exceptional 85.0% |
| Immigrants | Argentina | 90.6 /100 | #128 | Exceptional 85.0% |
| Immigrants | Western Africa | 90.2 /100 | #129 | Exceptional 85.0% |
| Immigrants | Spain | 90.0 /100 | #130 | Exceptional 85.0% |
| Chinese | 89.6 /100 | #131 | Excellent 85.0% |
| Immigrants | Israel | 89.5 /100 | #132 | Excellent 85.0% |
| New Zealanders | 89.5 /100 | #133 | Excellent 85.0% |
| Immigrants | Chile | 89.2 /100 | #134 | Excellent 85.0% |
| Immigrants | Asia | 88.9 /100 | #135 | Excellent 85.0% |
| Jordanians | 88.6 /100 | #136 | Excellent 85.0% |